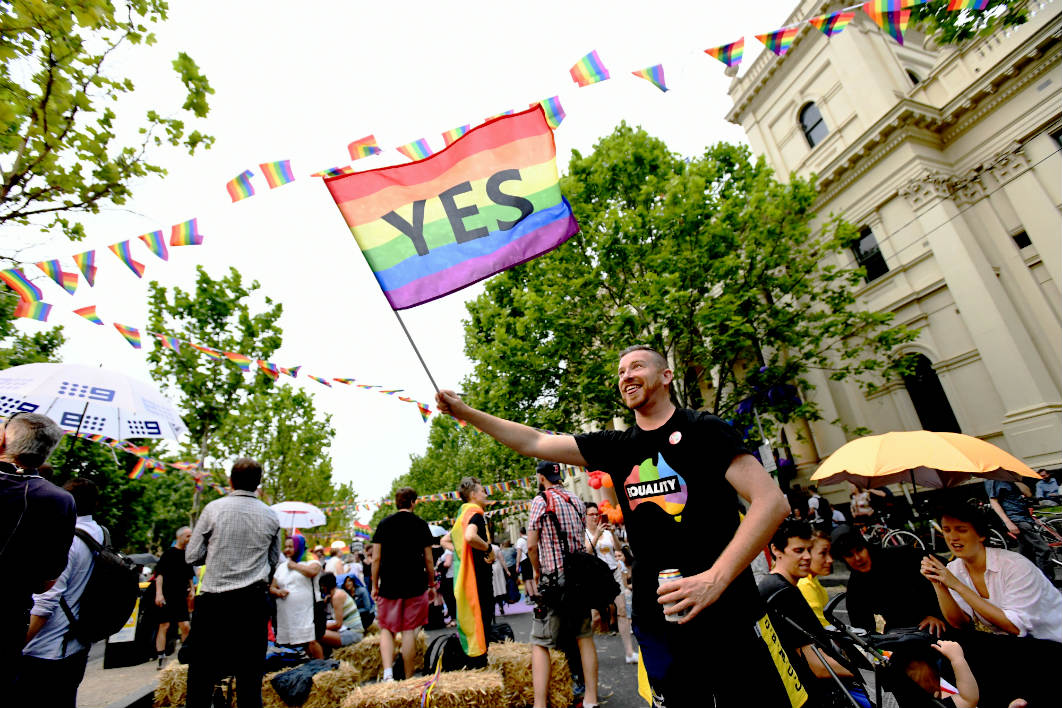
The same-sex marriage survey results are already providing much fodder for those whose vocation (or hobby) is to pore over statistics to gauge the mood of the times. Solid and occasionally overwhelming No majorities in several western Sydney seats have received the most notice, being read as an indication of the role of ethnicity, or non-English-speaking background, or recent migrant arrival, or religiosity in fostering negative attitudes towards change in the marriage law.
The unusual nature of the survey campaign, being voluntary, postal, and led by coalitions who lacked the resources or structures of the major political parties, will also have influenced the nature and reception of the messaging. If you’re starting a long way behind, as the No side did, and are more limited than publicly funded political parties in what you can spend, it might make sense to target a promising group of voters who can be influenced by working through established organisations, networks and leaders. If many of those voters have a limited grasp of English or of the substance of the issues at stake, they might also be more receptive to the drawing of long bows about freedom of religion and the corruption of children that were the stock-in-trade of the No campaigners and their friends at the Australian. Yes campaigners, on the other hand, had good reason not to bother with those likely to be unconvertible, and rather to concentrate on persuading voters likely to say Yes, especially the young, to return their forms.
The political parties themselves seem to have played a negligible role, with even the party leaders rather marginal. Not a few of the well-paid politicians who normally pride themselves on being leaders in their communities look to me like they ran dead, and that applies to both sides of the debate.
But we will need to wait for closer analysis of the campaigns to see how they worked in practice. Political scientists and sociologists will be busy for quite some time yet.
Not surprisingly, the initial media analysis of the No vote has focused on Sydney, but it’s striking that two ethnically diverse Melbourne divisions, Bruce and Calwell, also produced solid No majorities. They have much in common with several of the western Sydney divisions. In Bruce, in Melbourne’s outer southeastern suburbs, the 2016 Census tells us that six out of every ten residents were born overseas and a language other than English was spoken in almost 58 per cent of households.
Calwell, at the other end of town, recorded the state’s lowest Yes vote, at 43.2 per cent. Sitting in the city’s ethnically diverse northwest and named after the architect of Australia’s postwar immigration program, 54.4 per cent of its residents were born in Australia, a much larger proportion than in Bruce, but six out of every ten have two overseas-born parents. Calwell, like Arthur himself, also appears to be very religious, at least if formal affiliation counts: around 57 per cent of its residents identified as Catholic (34 per cent), Muslim (17.7 per cent) or Eastern Orthodox (5.4 per cent).
In nearby Scullin, though, with a higher proportion again of Australian-born residents (57.7 per cent), fewer households speaking a language other than English (about half) and a lower proportion identifying an affiliation with the Catholic or Eastern Orthodox Churches or Islam (around 46 per cent), the Yes vote was 53.4 per cent. That’s still well below the national and state average, but a majority nonetheless. Holt and Gorton — both Melbourne outer-suburban electorates with over half the population born overseas — also recorded small or bare Yes majorities. We perhaps find in all this a somewhat paler version of what came to pass in western Sydney.
Gentrified or gentrifying reas of Melbourne’s inner north with a longer history of ethnic diversity — much of the territory south of the Hipster Line (or Bell Street, as it is also known) — were bastions of Yes support. Wills recorded 70 per cent and Batman 71.2 per cent, both well above both national and state averages. Grayndler, an inner-western Sydney seat comparable with these in many respects, delivered almost 80 per cent.
Indeed, the inner metropolitan areas of the major cities voted overwhelmingly Yes, much as expected. More than four out of every five voters in Melbourne and Melbourne Ports, and similar numbers in Sydney and Wentworth, voted Yes, as did almost as many in Brisbane. It mattered nought whether a seat was safe Labor, safe Liberal or, in the case of Melbourne, Greens territory. Affluent Liberal-voting metropolitan seats in Sydney, Melbourne and Brisbane — even Tony Abbott’s Warringah — returned Yes votes in the seventies. But ethnically diverse Bennelong, with more than a fifth of the population claiming Chinese ancestry, recorded a slight No majority. Less than half the population there is Australian-born.
Hardly less interesting is the regional picture. Now, clearly, there are regionals and there are regionals. Most, these days, contain one or more sizable cities; many, especially on the coastal strip, have experienced drastic demographic change. We should hardly be surprised to find a seat such as Richmond on the north coast of New South Wales, with Byron Bay within its boundaries, producing a Yes vote just shy of 68 per cent, or nearby Page offering up 59.7 per cent. The urban divisions of the Hunter, the Illawarra, the New South Wales central coast, the Victorian goldfields and Geelong were overwhelmingly in favour. Wannon in Victoria’s Western District, a safe Liberal seat, more or less echoed the national average with a 61 per cent Yes.
Elsewhere, the Yes majorities in what are normally called “conservative” rural and regional seats were sometimes in the low to mid 50s: in New South Wales, this includes New England, Parkes, Riverina, Farrer and Lyne — all except Farrer (Sussan Ley, Liberal) being fairly solid National Party seats. The pattern of sometimes low but usually comfortable Yes majorities also occurs in Barker and Grey in South Australia, and O’Connor and Durack in Western Australia.
In compact Victoria, regional seats almost invariably contain one or more large regional cities. In a rare case where the cities and towns are smaller — such as the seat of Mallee (54.3 per cent) — the narrow Yes majority was similar to several ethnically diverse outer-suburban Labor seats of Melbourne. Much the same pattern emerged in Tasmania, where the most rural seats — Lyons and Braddon — recorded the smallest Yes majorities, being outdone by the seats based on Hobart, where the highest Yes vote in Tasmania occurred, and Launceston. Bass, based on Launceston, like Wannon in Victoria, almost precisely matched the national average Yes vote.
A small number of outback and regional Queensland seats rejected same-sex marriage: Maranoa, at 43.9 per cent, partly encompassing Joh Bjelke-Petersen’s old Kingaroy stomping ground; and Groom (49.2 per cent) in the Darling Downs, centred on Toowoomba. Both areas incorporate parts of southeast Queensland well known for the strength of their conservative Christian values — a kind of antipodean Bible belt. The sprawling northern Queensland seat of Kennedy, represented by Bob Katter, an outspoken opponent of same-sex marriage, recorded a Yes minority of 46.7 per cent, but Dawson was just over 55 per cent, and Leichhardt, represented by Liberal same-sex marriage advocate Warren Entsch, voted 63.4 per cent in favour.
It’s hard, in the case of Kennedy and Dawson at least, not to wonder about the role of the local member as an opinion-leader, although it is unclear where this would leave George Christensen, a No advocate, whose Dawson recorded that solid Yes. Perhaps some no-nonsense Liberal National Party voters regard his preoccupation with such “moral” issues with tolerant amusement. On this issue at least, his clout seems to have been limited, an experience familiar to several Labor MPs representing western Sydney electorates.
Before we get a sharper picture of what all this means, we will need more thorough analysis correlating survey voting with Census data, party allegiance and the like. It is nonetheless hard not to be impressed by the extent to which acceptance of same-sex marriage is a truly national phenomenon. Remember all that chatter back in the 1990s about a Melbourne-Sydney-Canberra triangle that was supposedly dominated by “elite” and “leftist” concerns remote from the rest of Australia? The patterns of Yes and No voting in the same-sex survey surely suggest something quite different. At the very least, the triangle looks very large and cumbersome, seemingly encompassing dozens of regional towns and cities across Australia.
There are perhaps two ways of looking at this change. A cynical attitude might be that Yes campaigners have been so successful in mainstreaming same-sex marriage — presenting LGBTI people as “pseudo-straight,” as one gay critic of the phenomenon recently put it, divorcing queer politics from its radical roots — that many conservatives are now willing to give it a tick. A more optimistic view might celebrate a significant expansion of our collective sense of what equality might mean in a modern democratic community.
I suspect that both readings are valid — that we are dealing here, as in so much democratic politics, with the eternal dance of sameness and difference. ●
