
For many years the debate about Australian schools has been influenced by the claim that public funding of non-government schools is good policy because it saves money for governments. As the Australian’s Adam Creighton claimed last year, “If the 1.24 million students now in private primary and secondary schools were shifted back to public schools, Australian governments would face an annual extra cost of $9 billion.” To stop funding private schools would amount to “fiscal suicide,” one commentator has claimed; according to another, it would create a “financial tsunami.” Government funding for private schools is “a highly efficient and effective use of government resources,” says the Independent Schools Council of Australia.
Claims like these usually refer to average recurrent costs across the entire government, Catholic and Independent school sectors. In reality, the costs of schooling vary according to location and enrolments. Students with advantaged backgrounds and circumstances are less costly to educate; those coming from less well-off households need more support.
Using data on the My School website we can make a more illuminating comparison of the sectors by matching schools that enrol similar students. In other words, we can compare like with like across government and non-government schools. My School provides a consistent set of figures across those sectors – unlike some other data sources – and its financial data, just two years old, is the most up-to-date available.
What the data reveals is that – if recent trends continue – over 40 per cent of students in Catholic schools will receive at least as much public funding as their peers in similar government schools in 2016. Two years later, it’s likely that another 40 per cent of Catholic-educated students will join them. And by the end of the decade, half the students in the other non-government school sector, Independent schools, are on track to get as much as, if not more than, government school students.
So how much do federal, state and territory governments pay each year to run government and non-government schools? Or rather, how much did they pay in 2013, the most recent year for which finance data is available on My School?
In spite of their limitations, let’s start with the simple averages, since they have been used almost universally in the schools debate. According to figures from the Australian Curriculum, Assessment and Reporting Authority, or ACARA, state and federal governments spent an average of around $11,865 in recurrent funding on each government school student in 2013. They spent around $9548 per Catholic school student, 80.5 per cent of the government student figure, and $7791 per Independent school student, around 66 per cent of the government student figure. On a simple gross average, government school students still get the most from governments.
But even these averaged figures don’t support the claims often made about “savings.” If the saving is taken to be the difference in recurrent cost to government of a child in an “average” private school ($8764) and the same child in an “average” public school ($11,865) it amounts to a difference of $3101 per child. If we extend this difference across the roughly 1.25 million non-government school students, the recurrent funding amount “saved” by governments by funding non-government schools in 2013 was closer to $3.9 billion than the often-claimed $9 billion. (Our detailed calculations for these and all other figures in this article are given in our recent report, Private School, Public Cost.)
But let’s set these spurious numbers aside and examine the situation more systematically. The actual funding amounts vary considerably, especially between students at the advantaged and disadvantaged ends of the spectrum. At the disadvantaged end, students in all school sectors received considerable public funding, well over the $20,000 mark in 2013. This is entirely appropriate: many of these students have high learning needs, live in remote places, or both, and their parents have few resources with which to assist them. At the advantaged end, government school students were usually funded at a rate below $10,000 from government sources in 2013, with those in non-government schools receiving public funding of between 50 per cent and 85 per cent of this amount.
Given that funding levels vary so substantially and for good reasons, the only way to understand the real differences in funding by sector is to analyse large numbers of schools enrolling similar students. Indeed, we should look at all of the schools for which usable data is available. But rather than aggregating them together, we should examine them in “educational advantage” groupings, from the lowest to the highest, and make a real effort to ensure that we are comparing like with like.
ACARA’s Index of Community Socio-Educational Advantage, or ICSEA, enables us to sort schools into groupings that are approximately equivalent on the basis of the factors that go into ACARA’s calculations. The ICSEA values on My School use a scale with 1000 as its midpoint, with more educationally advantaged school communities attracting a higher figure and less advantaged communities a lower figure. ACARA is sufficiently confident of its index that much of My School is dedicated to enabling comparisons of individual school NAPLAN results on the strength of it.
The box below compares schools and their communities in two contrasting ranges of educational advantage: a group of schools in the low 900s of ICSEA and another similar-sized group in the high 1000s. (These analyses exclude special schools and schools for which relevant data was not reported on My School.) Although these two categories bring together a quite wide range of schools and communities, the disparities between them are very noticeable. Differences in socio-educational advantage do attract different levels of funding, and the differences in public funding between the sectors within each group tend to be smaller than for the overall sector averages.
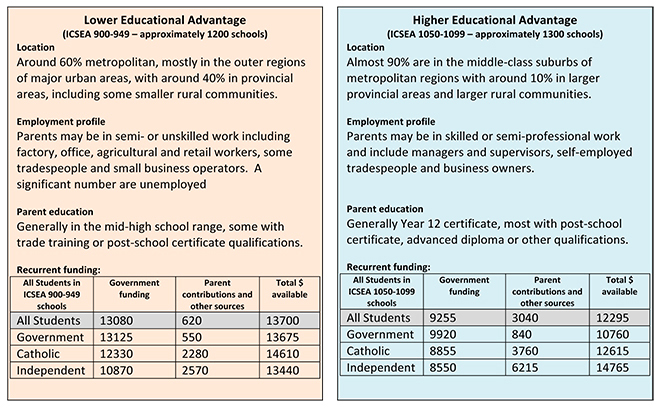
In the less advantaged group, Catholic students received 94 per cent of the public funding received by the equivalent government schools. Independent school students fared less well, but still received 83 cents for every dollar that governments expended on a government school student. When parent contributions are added, the totals spent by each sector were comparable, with students in Catholic schools some 7 per cent ahead of the rest.
In the more advantaged group, government grants per student were lower overall, but Catholic students still received almost 90 per cent of the government school students’ funding, while Independent schools received 86 per cent. Of course, the parents in this case were able to more than compensate the difference, and in the end their students had the benefit of 118 per cent and 137 per cent respectively of the total amounts spent on their government school peers.
What these figures show is that the most realistic way of calculating how much governments “save” by funding private schools is to compare costs at similar levels of advantage. To do otherwise is to assume that the average (relatively advantaged) private school student should attract the same recurrent funding as the average (relatively disadvantaged) public school student. Using the 2013 data and dividing the nation’s schools into ten ICSEA groupings, we calculate the total difference between government recurrent grants to private schools and recurrent funding of ICSEA-equivalent government schools at around $2.2 billion, just 5.7 per cent of the $38.9 billion total of government spending reported on My School for 2013.
If this relatively low figure comes as a surprise, then a further surprise might be found in the fact that the difference has actually been getting smaller year by year.
We now have five years of finance data on the My School website, enough to start identifying not only differences between states and sectors, but also trends over time. In an earlier analysis we showed how increases in funding between 2009 and 2013 were favouring schools with advantaged students. There were also clear sectoral differences in the distribution of government funding: between those years public funding (per student) increased by 12.4 per cent to government schools, 23.5 per cent to Catholic and 23.8 per cent to Independent schools.
Many factors affect the direction and distribution of funding. Special deals are struck and decisions are made in the heat of election campaigns (as they were most recently in Victoria and New South Wales). States and territories are choosing to implement what has evolved out of the Gonski recommendations in different ways. The effect of these and other changes can be seen most clearly if we look at the public funding of private schools as a percentage of the funding of equivalent government school students in the same year.
We can look first at the percentages for Catholic schools. Data for the full ICSEA range is presented below, although (as the coloured curve in the background indicates) most Catholic students are in schools in an ICSEA range between 950 and 1150.
Chart 1. Government recurrent funding of Catholic schools as a percentage of recurrent funding of ICSEA-equivalent government schools, 2009–13
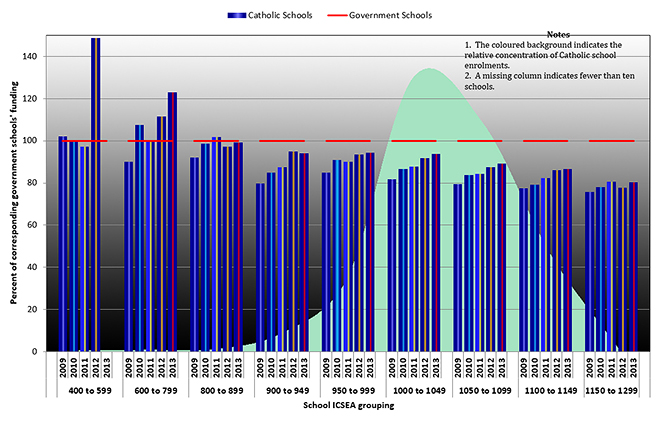
Source: Data from My School
This chart shows the recurrent public funding of ICSEA-grouped Catholic schools, with the amount in each year expressed as a percentage of the recurrent funding of government schools in the same year and ICSEA range (taken as 100 per cent within each range). In the ICSEA range 1000 to 1049 in 2009, for example, public funding for each Catholic school student was 82 per cent of public funding for each government school student. Four years later, in 2013, the figure had reached 94 per cent.
What this shows clearly is that the proportion of public funding to Catholic schools has risen in all ICSEA groupings over the years. It is easy to extrapolate the trend to conclude that within the next two to three years most students in Catholic schools will receive an average 100 per cent of government funding in several of the ICSEA groupings. Two of the groups (1000 to 1049 and 1050 to 1099) account for around 72 per cent of Catholic school students; on present trends, students in these groups will reach 100 per cent by the funding year of 2016–17.
Many individual Catholic schools are already at these levels. In another analysis, we surveyed recurrent funding of secondary schools in NSW and Victorian federal electorates for 2013 to discover that 30 per cent of Catholic schools in New South Wales and a substantial 60 per cent in Victoria were already funded by governments at higher levels per student than at least one similar or more disadvantaged government school in the same electorate.
Independent schools also show an upward trend in public funding. Half of the students in these schools are on track to be funded at or above the level for similar students in government schools by 2019–20. The direction and pace of growth is clearly evident in the chart below.
Chart 2. Government recurrent funding of Independent schools as a percentage of recurrent funding of ICSEA-equivalent government schools, 2009–13
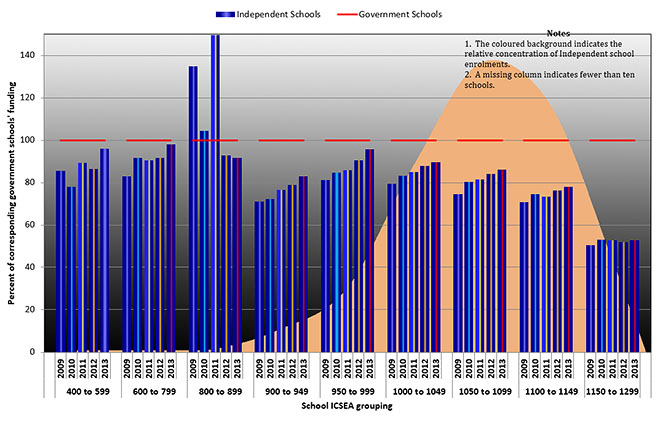
Source: Data from My School
Rapidly increasing levels of government funding have implications for all schools and raise many issues that should have been resolved years ago. Gonski’s recommendations would have achieved a sector-blind solution to problems that are now becoming even more obvious. It was not to be, and we have to deal with the consequences. Governments and school sectors will have to rethink what their schools are and what they do – and how they should be funded.
In some ways, government, Catholic and Independent schools have much in common. Their teachers and curriculum are much the same and their students jump through the same hoops. When schools enrolling similar students are compared, student results are not significantly different. Our analysis shows that they also get – or will soon get – much the same public funding for their operation.
The difference lies in their obligations. One sector is a fully funded public system, obliged by legislation and regulations to be accessible and available to all students. They are public schools and operate at public cost. The average ICSEA for schools in this system was around 983 in 2014.
Non-government schools also operate substantially at a public cost, but in a legal and technical sense they are privately owned and operated. They have complete flexibility in relation to whom they serve and how much they charge for the service. Their fees alone ensure that non-government schools will serve a more advantaged segment of the population. The 2014 average ICSEA for Catholic schools was around 1040 and for Independent schools around 1071.
It would be difficult to come up with a better script to entrench and exacerbate socioeconomic differences between schools and between communities. Other countries have avoided this problem: church schools in most OECD countries are fully funded but are obliged to operate in the same way and meet the same obligations as state-funded secular schools. Governments in those countries wanted to avoid the very problems that now face Australia.
The increase in public funding for non-government schools in Australia has happened gradually, without any accompanying review of their status within the total framework of schools. They have taken on greater compliance and accountability in areas such as curriculum, accreditation, workplace health and safety, and child protection. But their exemption from key obligations sets them apart in ways that are ever more at odds with their ever-more-substantial public funding.
Critics will be quick to point to instances of private schools working with disadvantaged and disabled students. These examples, while laudable and in some cases heroic, are relatively few in number and far from the norm.
For as long as we can remember, school funding in Australia has been driven by the claimed need to catch up with other schools, other sectors or other countries. As class sizes reduce in one sector there come demands that the same policies apply, and are funded, in others. As some schools acquire a new technology it becomes essential for everyone. In this way, the funding of non-government schools has been linked to the costs of government schools, even where the sectors enrol different students.
If restrictions on public funding of schools are on any agenda for change then the question of funding from school fees and other private sources has to be there as well. What should the role and scale of public funding be when some schools are funded, from all sources, at twice the level of others? The fact that much of this money comes from parents doesn’t deflect the question. The current funding regime, quite unique to Australia, makes governments active and willing partners in arrangements that sustain and actually worsen inequality. There may well be an argument for making public funding conditional on an appropriate ceiling being placed on combined funding from all sources, if only to ensure that our total investment in schools goes to where it provides the best returns.
It’s possible that the greatly increased public funding of non-government schools will revive demands that they be fully integrated into government systems, with all schools subject to the same obligations and rules. This solution has already been raised – especially in relation to Catholic schools – and dismissed as being too expensive for governments. That barrier is certainly much lower now.
For a number of reasons, the creation of such an integrated system in Australia would be problematic. But it may not be the solution anyway: integration might have slowed, but it certainly hasn’t stopped, the social separation between school communities in England. And even in integrated systems the rules can be bent, as can be seen in the re-emergence of what amount to school fees in New Zealand’s Catholic schools.
One option would be to require non-government schools to accept a wider range of obligations as a condition of public funding. In its submission to the Gonski review, the NSW Secondary Principals’ Council raised the idea of a charter for use of public funding. The purpose of such a charter would be to express the public purpose of government in providing public funding for education in operational terms. It would include specific reference to such matters as:
Public obligation: In accepting public funding, a school would agree to act as an agent for the government in terms of delivering its public purpose in education and agree to operate the school in a manner consistent with legislation and regulations applying to government schools within the jurisdiction. This would include provisions related to enrolment policies and practices; curriculum delivery & assessment; annual reporting; employment practices; child protection, discrimination & other social legislation; school uniforms; discipline procedures, including suspension & expulsion; and complaints procedures.
Fees: Where a school provides particular resources or services above and beyond those related to the public purpose, the school may charge fees for the provision of those resources or services, however the imposition and level of fees will have the effect of reducing the school’s entitlement to public funding.
Right of access: While non-government schools in receipt of public funding may declare and provide education within a particular faith or ethos for their client community, they should not unreasonably restrict the access to the school of any child, through fees or other administrative mechanisms, or to those parts of their educational program provided from public funds.
Some aspects of the proposed charter have already become part of practice in non-government schools, but there is considerable scope to do much more.
When the My School website entered its second year – and its data became far more reliable – we began to investigate what it was telling us about our whole framework of schools. We have separately and jointly published analyses that confirmed significant social divisions between our schools, divisions the OECD has reported as being greater than those found in equivalent countries.
In the fifth and sixth years of My School we wanted to find out whether the data revealed changes over time in such areas as student achievement, funding and equity. We especially wanted to know whether the data confirmed the findings of the Gonski review. Our analysis, published in Gonski, My School and the Education Market, not only confirmed Gonski’s warnings but also raised new questions. School funding has long been riddled with inconsistencies, opaque formulas and elusive deals, but we are now heading into territory that has not been charted anywhere in the world.
The problems created by inequity won’t go away without needs-based funding; we know that targeted investment in struggling schools makes a difference. Instead, Australia has created an uncomfortable combination of overfunded and manifestly underfunded schools. We don’t have to look too far to find an answer to the age-old question “where will the money come from?”
Each inequity in our hybrid system of schools has posed a challenge. Will governments intervene to create improved student outcomes, greater equity, transparency and a sustainable balance between the sectors? Gonski is as close as we have ever gone to achieve this. Or will they encourage even more narratives to justify inertia and inequity – and to justify funding “private” schools at levels increasingly above their own? •
This article is based on a new report by Chris Bonnor and Bernie Shepherd, Private School, Public Cost: How School Funding Is Closing the Wrong Gaps, which includes the detailed tables on which the data included in this article are based.