Soon after he became social services minister in September, Christian Porter declared that he was on the “hunt for savings” in his portfolio and hinted that carer and disability payments may need to be cut to get the budget back to surplus. A few weeks later the Daily Telegraph likened the welfare system to “a ticking time bomb” and quoted the minister’s observation that it was in “urgent need” of reform. “Government modelling has revealed taxpayer-funded welfare spending in today’s dollars by 2026 will be $81 billion more than current tax revenue,” the paper reported.
Porter developed his theme on Sky News. “In every single category of the very large spend in social services,” he said earlier this month, “the growth is, in any rational observation, unsustainable if it were to go on the way it’s gone on over the last ten years. In all areas, things like the disability support pension and a range of other payments – and there are many of them in the portfolio – they are growing at a rate greater than the ability of the tax base to sustain them.”
If these remarks sound familiar, it’s because they bear a strong resemblance to statements by Porter’s predecessor, Scott Morrison, who argued that “the social services budget could swamp the federal budget” and that “eight out of ten taxpayers work every day to pay our $150 billion welfare bill.” And last year Morrison’s predecessor as social services minister, Kevin Andrews, described welfare spending as “unsustainable” and “relentless.”
The disparity between spending and taxing that worries the Daily Telegraph is essentially meaningless, of course, because it compares spending in eleven years’ time with tax levels today. And, just like the argument that eight out of ten taxpayers work every day to fund the welfare system, the calculation appears to include only personal income taxes, not overall tax revenue (from where social security spending is financed).
Setting the context
To understand changes in welfare spending we need to factor in changes in the context in which welfare dollars are spent – population growth and the impact of an ageing population, for example, and changes in government policies and welfare categories.
One approach draws on the fact that in any year, by definition, the total amount of money spent on a social security program is equal to the number of people receiving the payment multiplied by the average amount of money they are paid. Using this simple arithmetic, it’s possible to look at the factors that determine the number of people receiving benefits and identify what influences the amounts they are paid. (This method has been used in Australia by Peter Saunders of the Social Policy Research Centre at the University of New South Wales, and more recently by researchers in Ireland.)
The number of people receiving payments reflects interactions between Australia’s growing population, changes in the age composition of the population, trends in the job market and in family structure, and the impact of government decisions about who is eligible for payments, as well as changes in other parts of the welfare system. The way individuals respond to changing incentives within the welfare system also affects patterns of payment.
The average level of payments will mainly reflect government decisions about benefit levels and income tests. (It’s important to remember that Australia’s income testing of benefits means that the average level of payments will nearly always be lower than the basic rate of entitlements.)
One of the more important decisions governments make is which indexing approach they will use to ensure that payments reflect changes in community living standards. A number of major payments – the age pension, the disability support pension, or DSP, and the carer payment – are currently indexed to wages, while most other income-support payments and family payments are indexed to prices.
As long as real wages are rising, payments indexed to earnings will rise in real terms – as will the overall cost of those payments, but even if payments are indexed to prices, the overall cost will rise, assuming the population isn’t falling. In these circumstances, the only ways to avoid the payment’s overall cost rising faster than inflation is either to cut the proportion of the population receiving the payment or to cut average benefits in real terms.
We also need to look at the system as a whole, and not just its parts. This is particularly important because Australia has a categorical system of income-support payments. To be eligible for a payment an individual needs to fall into a defined group – by being over the age of sixty-five, for example, or having a disability, or caring for someone with disability, or being unemployed or sick, or studying, or caring for children. We even have a payment – the special benefit – for low-income people who don’t satisfy the criteria for any of the other categories.
For any one person, these categories are mutually exclusive. An individual can simultaneously be over the age of sixty-five and have a disability that prevents him or her from taking paid work, for example, and a lone parent can also be looking for full-time work or caring for someone with disability. But these individuals can only receive one of the categorical income-support payments, even if they are potentially eligible for more than one.
This may make it possible to “game” the system by claiming the payment with the most favourable conditions. But it also means that when government policy changes and a payment is either abolished or phased out, or eligibility conditions are tightened, individuals may be entitled to claim a different payment. This also applies to groups of people at different times: following a change of policy, a class of people who might previously have been able to claim one type of payment might be eligible for another payment.
In fact, some policy reforms are designed to move groups very quickly from one payment to another. If we only analyse one payment at a time we overlook this potential substitution and gain a very limited view of what is actually going on in the welfare system.
The final context for analysing welfare spending is historical. In my earlier assessment I used Department of Social Services, or DSS, statistical reports going back to 1991 and data collected by its predecessor departments since the 1960s. Because the population has not only grown significantly but also changed its age composition, the following charts divide the population into people aged between sixteen and sixty-four (the working-age population) and people aged sixty-five or more.
Picking the trends
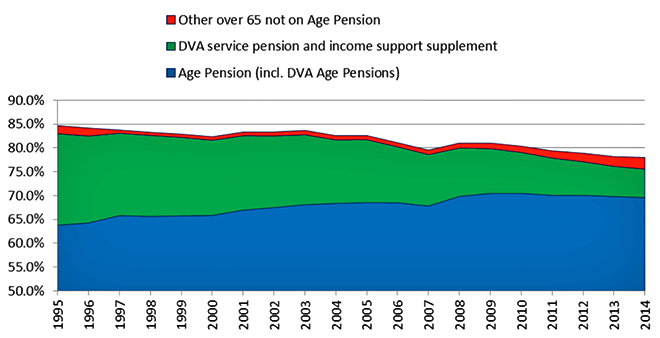
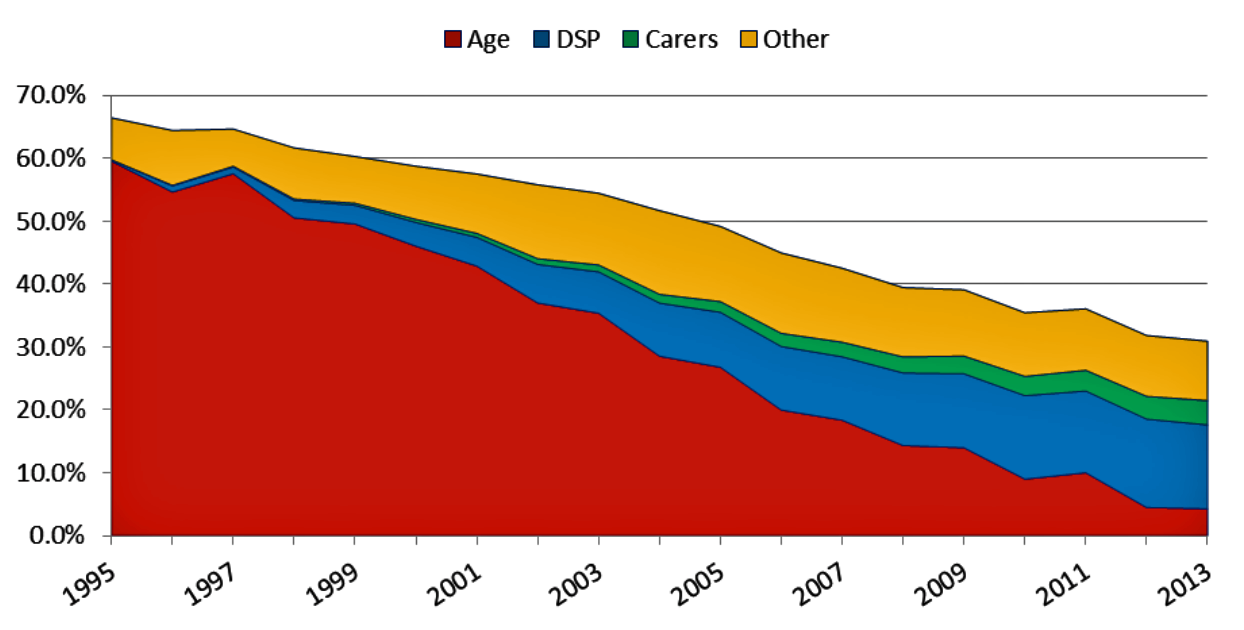
Chart 1 shows trends in the percentage of people aged sixty-five and over who received income support of different forms between 1995 and 2014. As it makes clear, the proportion of older people receiving an age pension either from the DSS or the Department of Veterans’ Affairs, or DVA, has increased from around 64 per cent of the population in 1995 to close to 70 per cent in 2014. The proportion receiving a DVA service pension in combination with an income-support supplement, however, has fallen from around 19 per cent to 6 per cent, while the proportion receiving other payments – mainly the DSP, the carer payment or the special benefit – has increased from 1.7 to 2.6 per cent.
The total number of people receiving one of these payments has gone up by close to 700,000, but this is simply because the number of people over sixty-five has increased by 1.36 million. The proportion receiving one or other of these payments has fallen from around 85 to 78 per cent.
Chart 1: Trends in the percentage of the older population receiving income-support payments, Australia, 1995–2014
Source: Calculated from Department of Social Services, Income Support Customers, A Statistical Overview, various years; Department of Social Services, DSS Payment Demographic Data, June 2014; ABS, Australian Demographic Statistics, 2014.
The decline in the share of the older population receiving a service pension plus an income-support supplement largely reflects the movement of the people who were in service during the second world war into this payment between the 1970s and 1980s and then out again, through death, and the subsequent lack of any large-scale war experience.
Age pensions (either from DSS or DVA) are alternatives to service pensions. But the fact that the increase in the share receiving age pensions was only about half the size of the decline in the share receiving service pensions suggests that potential new entrants are better off than previous groups of people turning sixty-five. And, as compulsory superannuation increases retirement resources in future years, the share of older people receiving an income-tested payment is likely to decline further – although the full effect will not be seen until after 2030 when retirees will have had the opportunity to contribute over their full working lives.
Trends among people of working age differ significantly from those among people over the age of sixty-five. Chart 2 shows the proportion of people aged sixteen to sixty-four receiving income-support payments between 1995 and 2014. After a small jump in 1996 there was a long, steady decline, with a more modest rise and fall since 2008.
Chart 2: Trends in the percentage of the working-age population receiving income-support payments, Australia, 1995–2014
Note: Working age is defined as the population aged sixteen to sixty-four years. Source: Calculated from Department of Social Services, Income Support Customers, A Statistical Overview, various years; Department of Social Services, DSS Payment Demographic Data, June 2014; ABS, Australian Demographic Statistics, 2014.
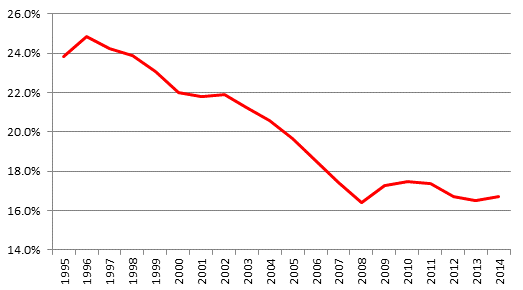
The rate in the chart has been calculated to show the impact of one of the most important policy changes in social security over the past twenty years. In 1995, the Keating government began lifting the eligibility age for women to receive the age pension from sixty to sixty-five years. This was phased in between 1995 and 2013, with the number of women aged sixty to sixty-four years receiving an age pension falling from 211,000 in 1995 to zero in 2014.
In order to be consistent over time, female age pensioners between sixty and sixty-four years are included in the working-age group over the whole time period. This figure also excludes a smaller – but growing – group of people who are receiving working-age payments but who are actually over sixty-five years of age.
Chart 2 shows that at the peak in 1996, nearly 25 per cent of the working-age population was receiving basic social security payments. By 2014 the figure was 16.8 per cent, a decline of around eight percentage points, or close to a third.
While numbers on payments are available for 2015, Australian Bureau of Statistics, or ABS, data on the age composition of the population are not. But we do know that the number of working-age people on payments rose by around 1.9 per cent in the year to June 2015 and the total Australian population rose by 1.4 per cent in the year to March 2015. Given that the population under sixteen years of age has been rising at a slower rate than any other group, it seems unlikely that the rate of receipt of payments has changed to any large extent, although it is possible that it has gone up slightly.
What explains these fluctuations? The number of working-age people receiving welfare payments at any one time is strongly related to the state of the labour market. Not surprisingly, it increases significantly in periods of recession. During the last major recession, in the early 1990s, unemployment peaked at 11 per cent, but by February 2008 it had fallen to 4 per cent, the lowest level since 1974. So part of the explanation for the long-term decline is Australia’s very strong employment performance, particularly before the global financial crisis.
But other factors are at work as well, including the dynamics of different categories of payments. Changes in the number of lone parents receiving benefits partly reflect shifts in family formation, for example. People who are unemployed for lengthy periods and experience a disability may drop out of the labour market and end up on the DSP. Unemployment can lead to family breakdown and growing lone parenthood.
Policy changes are also a major cause of trends in the number of welfare recipients. In periods when benefits are more generous or easier to access, the number of recipients naturally tends to grow, while tighter or less generous conditions have the opposite impact.
Reflecting these and other factors, as was shown in Chart 2, the proportion of people receiving welfare payments peaked at nearly one in four of the working-age population in 1996, before falling to roughly one in six in 2008, just before the global financial crisis. After the GFC, the proportion of working-age people receiving benefits rose to 17.5 per cent in 2010, then started to fall again, reaching 16.7 per cent in 2014 – not quite back to the 2008 level, but the second-lowest level in the past two decades.
Chart 3 breaks down trends since 1995, showing what has happened to the share of the working-age population receiving the DSP, the share receiving unemployment-related payments, the share receiving the carer payment, and the percentage receiving any other form of working-age income support, including parents, the sick, wives, widows, partners and recipients of student assistance.
Chart 3: Trends in the percentage of the working-age population receiving selected income-support payments, Australia, 1995–2014
Note: Working age is defined as the population aged sixteen to sixty-four years. These figures are adjusted to include women aged sixty to sixty-four years on age pensions in the working-age payment population and to include people sixty-five years and over and not on age pensions in the retirement age payment population. Source: Calculated from Department of Social Services, Income Support Customers, A Statistical Overview, various years; Department of Social Services, DSS Payment Demographic Data, June 2014; ABS, Australian Demographic Statistics, 2014.
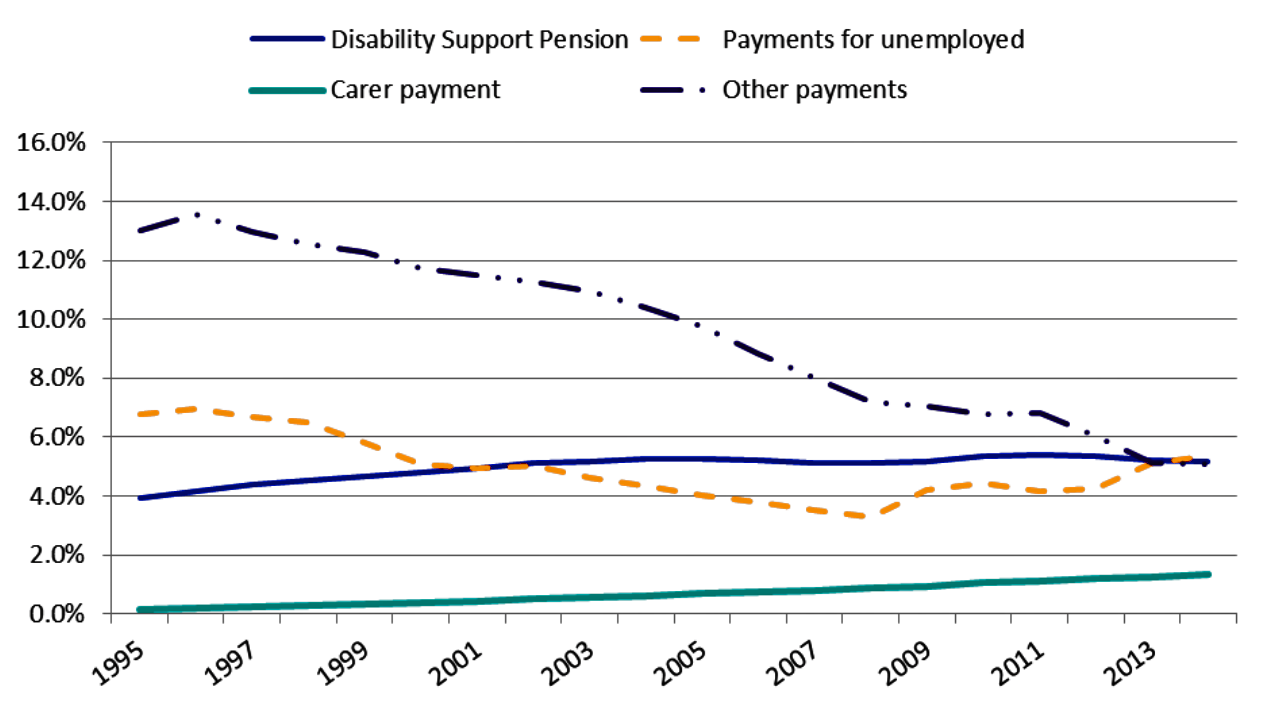
What is apparent is a fairly steady rise in the share of people on the DSP, from 3.9 per cent of the working-age population in 1995 to a peak of 5.4 per cent in 2011, falling slightly to about 5.2 per cent in 2014. The number of people of working age on this payment fell further from 790,000 in 2014 to 778,000 in 2015. Interestingly, the number of people aged sixty-five and over who receive the DSP rose from around 4000 in 1995 to nearly 40,000 in 2014, presumably because they have not lived in Australia long enough to receive an age pension, but acquired a disability after they settled here.
The long decline in the share of the working-age population receiving unemployment payments before the GFC is also apparent, with an increase in 2008–09 and a sharper increase between 2012 and 2013. The proportion of people on the carer payment rose from a negligible 0.2 per cent of the working-age population in 1995 to 1.4 per cent in 2014.
What is most striking, however, is the trend in the number receiving “other” payments, which peaked at 13.6 per cent of the population in 1996 but had fallen to 5.1 per cent by 2014. In numerical terms, the number of people receiving these benefits has fallen from 1.6 million in 1996 to 781,000 in 2014 (and further to 758,000 in 2015). The improvement in labour-market conditions between 1996 and 2008 is likely to have contributed to the decline in the share of working-age people on these other payments, but policy changes appear to be the most important factor.
What these figures show is that if we only look at the programs in which numbers have been going up – the DSP, the carer payment and, more recently, unemployment payments – then we will have a very partial view of overall trends and miss the contribution of policy changes in other parts of the system.
Looking at the system as a whole
Why has the percentage of the working-age population receiving DSP and the carer payment been rising since 1995, and the share receiving unemployment payments rising since 2008, while the share receiving other payments has declined significantly? The state of the labour market is part of the answer, and so are two other factors that have had a major impact among people of working age: the ageing of the baby boom generation and the major social security policy reforms introduced by successive Australian governments over the past two decades.
Chart 4 shows the age profile of the main social security payments for people of working age in 2014 (the most recent year for which ABS data on the age structure of the population are available), including the Newstart unemployment benefit as well as payments already mentioned. The figure excludes student payments, which primarily go to people under twenty-five, and age pensions, which go to people over sixty-five. (Around 9 per cent of people under twenty-five receive student assistance and 72 per cent of people over sixty-five receive an age pension or another DSS payment.)
Chart 4: Percentage of age group receiving income-support payments by payment type, Australia, 2014
Source: Calculated from Department of Social Services, DSS Payment Demographic Data, June 2014; ABS, Australian Demographic Statistics, 2014.
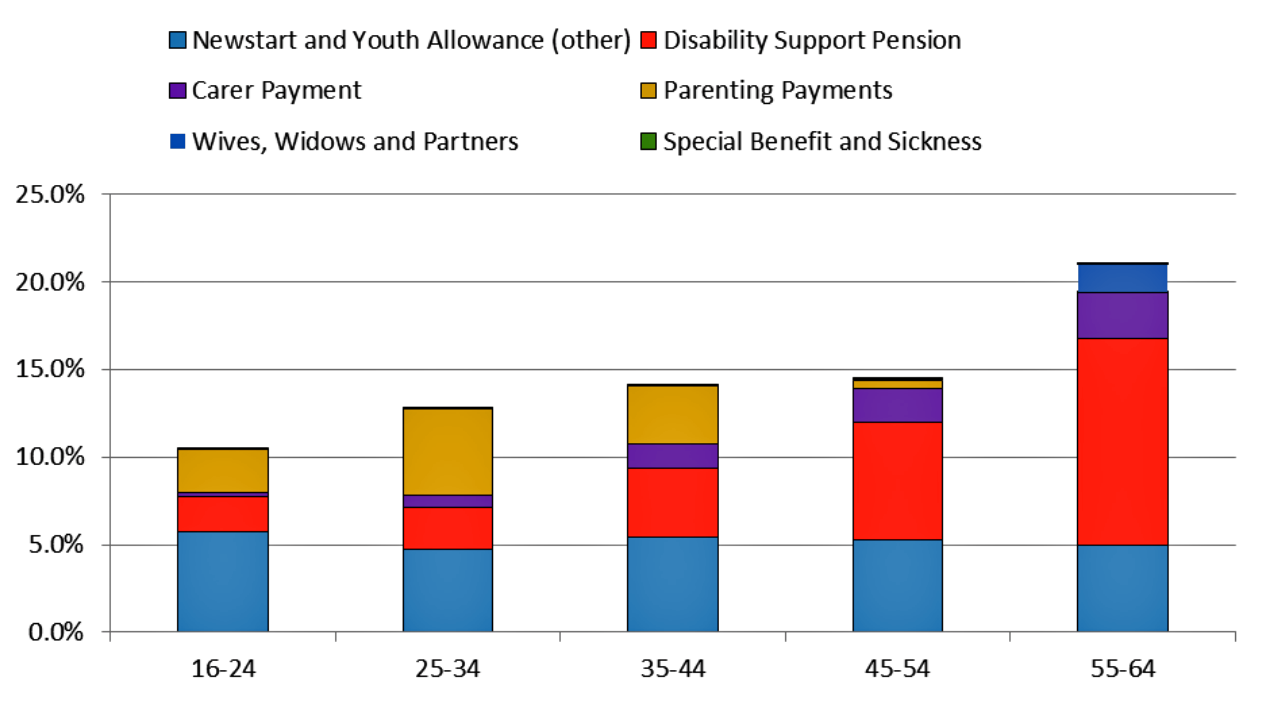
The proportion of people receiving social security benefits clearly increases with age – doubling from 10.5 per cent of those aged under twenty-five to 21 per cent of those aged fifty-five to sixty-four, although for those between these two age groups rates of receipt only range between 14 and 15 per cent.
Not all payments are higher among older age groups: employment-related payments are received by around 5 per cent of each age group, and the parenting payments peak at around 5 per cent of those aged twenty-five to thirty-four years and then decline. But in the other major categories, payment rates rise significantly with age – particularly for people receiving DSP, who make up around 2 per cent of those under thirty-five, 4 per cent of those aged thirty-five to forty-four, 7 per cent of those aged forty-five to fifty-four and close to 12 per cent of those aged fifty-five to sixty-four.The proportion of people receiving the carer payment also rises from less than 1 per cent of those aged twenty-five to thirty-four to 2.6 per cent of those aged fifty-five to sixty-four. People receiving wives, widows or partner payments are predominantly aged between fifty-five and sixty-four years.
Why? The obvious answer is that the likelihood of acquiring a disability increases with age as a result of lifestyle-related diseases and natural wear and tear, particularly for those with manual jobs. The US Social Security Administration estimates that more than 25 per cent of current twenty-year-olds will acquire a disability before the age of sixty-five. It is also obvious that the number of people who need to care for relatives with disability will rise as the structure of the population shifts.
For these reasons, the number of people receiving social security is influenced not only by changes in the population but also by changes in its demographic profile, particularly by the share of the population in the age groups over fifty years of age.
Chart 5 shows changes in the size of the population in different age groups in Australia between 1995 and 2014, separating out the changes since 2005 from those over the longer period.
Chart 5: Percentage changes in the size of the population by age group, Australia, 1995–2014
Source: Calculated from ABS, Australian Demographic Statistics, 2014.
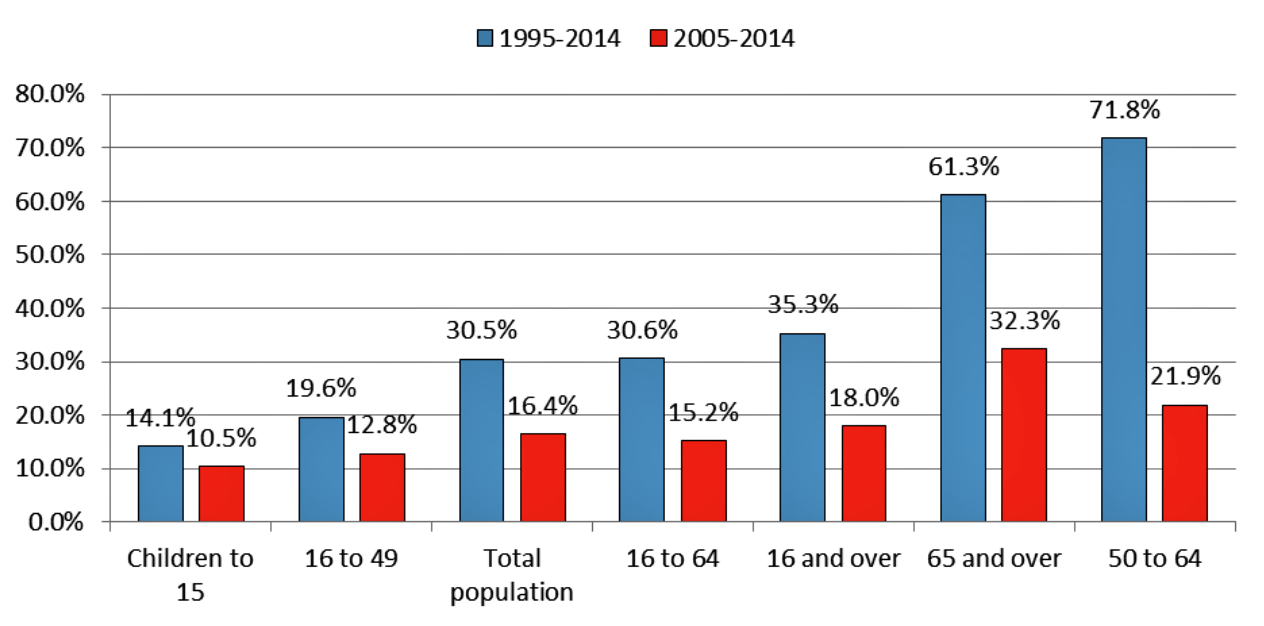
Between 1995 and 2014 the total Australian population increased by close to 31 per cent and the population over sixteen years of age increased by just over 35 per cent. It is important to understand the implications of this: if all income-support payments were simply indexed to prices and if the share of the population over sixteen and the percentage of the population receiving benefits remained constant, then we would expect real social security spending still to have increased by 35 per cent since 1995.
Different age groups have also grown at very different rates. The number of children in the population has increased by only 14 per cent since 1995, or less than half the rate of the increase in the total Australian population, while the proportion of the population between sixteen and forty-nine has grown by around 20 per cent. Meanwhile, the proportion of the population aged sixty-five and over increased at more than twice the rate of the total population. Even more strikingly, the population aged between fifty and sixty-four – those working-age groups whose receipt of social security is highest – increased by nearly 72 per cent.
But trends in the second half of this period differ in subtle but significant ways. The total Australian population increased at about the same rate as in the whole period, but the share of children rose at a faster rate. The rate of increase in the population aged fifty to sixty-four years fell by close to 70 per cent, but the number of people aged sixty-five years and over grew marginally faster in the second period than it did over the whole period.
These trends reflect divergent demographic movements, primarily the ageing of the baby boom generation and to a lesser extent the increase in total fertility rates after 2000. Baby boomers were born between 1946 and 1964 and started to turn fifty in 1996 and sixty-five in 2011. The ageing of this generation initially increased the percentage of the population in the age groups likely to receive DSP and the carer payment, and more recently has boosted numbers in the age range potentially entitled to the age pension. Up until 1996, as demographer Natalie Jackson has shown, changes in the age structure of the Australian population acted to slow the growth of the DSP. But when people born in 1946 started to turn fifty in 1996, that slowdown was reversed.
The effect of the ageing of the baby boom generation is illustrated in Chart 6, which shows the change in the number of people by years of age between 1996 and 2014 (after taking account of deaths and migration). The largest population increase is among fifty- to sixty-seven-year-olds, with each year group being around 100,000 larger than the comparable group in 1996. Cumulatively, there were 1.9 million more people aged fifty to sixty-four – the age at which rates of receipt of the DSP start to rise significantly – in 2014 than in 1996.
Chart 6: Change in number of people sixteen and over by age, Australia, 1996–2014
Source: Calculated from ABS,Australian Demographic Statistics, 2014.
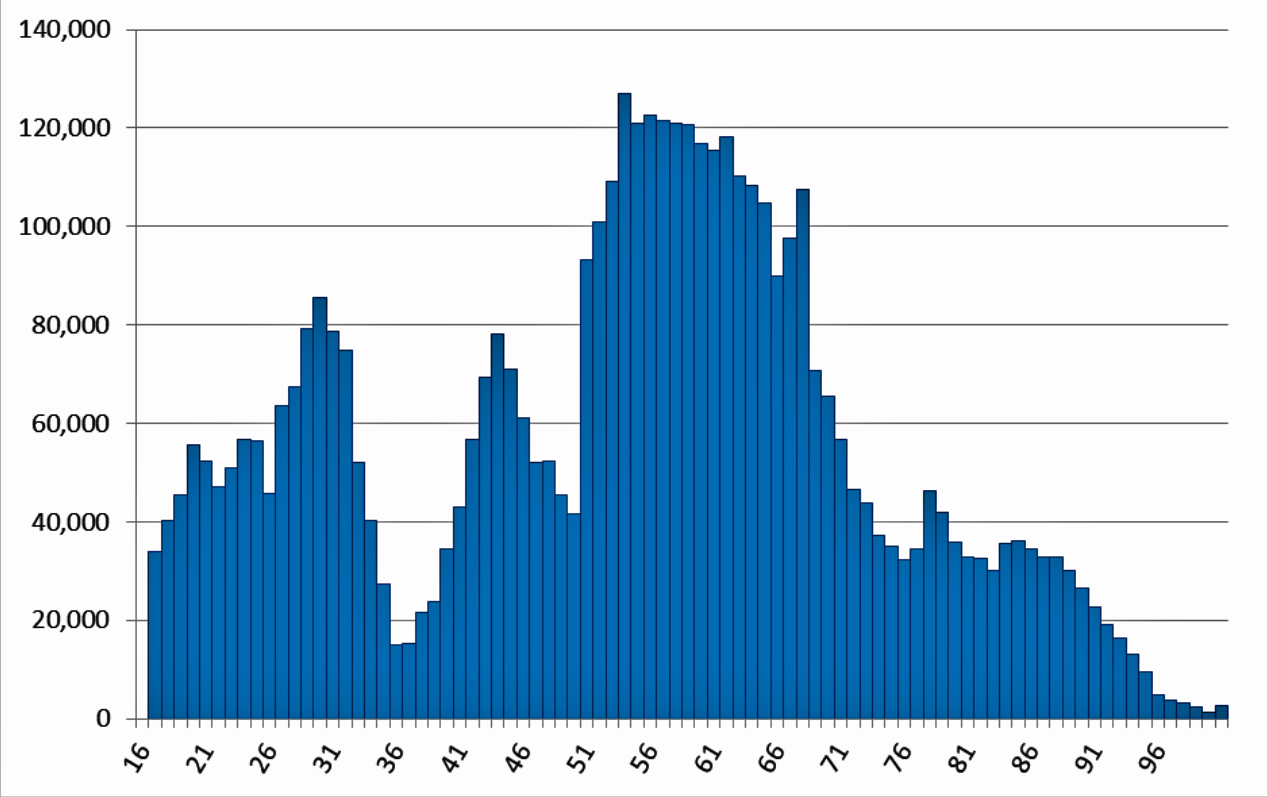
Between 1996 and 2012 the proportion of people of working age receiving the DSP rose from 4.3 per cent to 5.6 per cent. If the age structure of the population had held constant at 1996 shares, then the figure would have been 5.0 per cent – in other words, roughly half of the total increase can be said to be unrelated to changes in the labour market, the incidence of disability or individual behaviour, but simply reflects changes in the age structure of the population.
The chart also shows that, beginning in 2015, the increase in the size of each year cohort will decline significantly, and then increase again, before declining again. For example, while there were 93,000 more fifty-year-olds in 2014 than in 1996, there were only 42,000 more forty-nine-year olds (and 15,000 more each of thirty-five- and thirty-six-year-olds). These shifting patterns suggest shifts in the number of potential inflows into the DSP and other payments predominantly claimed by people over fifty.
More importantly, a series of policy changes from the late 1980s and mid 1990s also had a major impact on the number of people receiving the DSP and other payments.
One of the most important of these was the increase in the age pension qualifying age for women from sixty to sixty-five, as already mentioned. Before 1995, women receiving the DSP were required to shift to the age pension once they turned sixty, and women who became disabled after turning sixty weren’t able to claim the DSP unless they had lived in Australia for less than the ten years needed to qualify for an age pension.
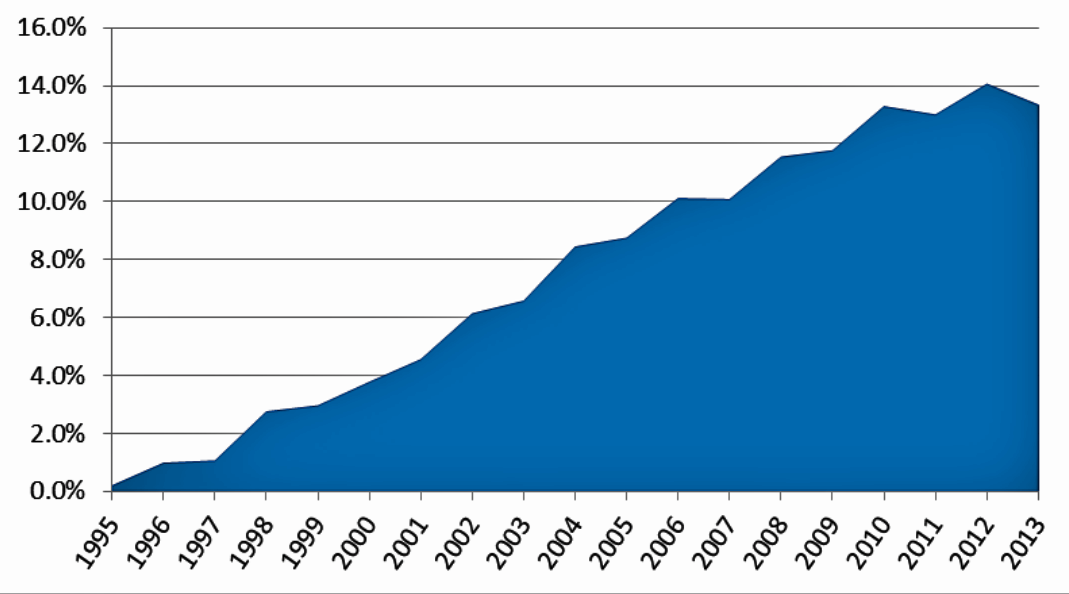
As the cut-off age started to increase, women with disabilities in this age group increasingly claimed the DSP. As Chart 7 shows, the proportion rose from close to zero to 13.3 per cent by 2013. (Age breakdowns by gender are not available for subsequent years.) But as the number of women receiving the DSP went up, the number receiving the age pension went down – and, as Chart 8 shows, it went down by much more.
Chart 7: Change in percentage of women aged sixty to sixty-four years receiving the DSP, Australia, 1995–2013
Source: Calculated from Department of Social Services, Income Support Customers, A Statistical Overview, various years; Australian Bureau of Statistics, Australian Demographic Statistics, June 2013.
In 1995, only about 650 women aged sixty to sixty-four received the DSP and 212,000 received the age pension. By 2013, 86,000 women in that age group received the DSP, and only 27,000 were age pensioners. (And since 2014 none have received the age pension.) The number of female carers has risen from 132 in 1995 to more than 24,000 in 2013. Where once 67 per cent of women of that age received a pension or other payment, now the figure is 31 per cent. Overall, close to a quarter of the growth in the number of DSP recipients over the past twenty years can be accounted for by the growth in the number of women aged sixty to sixty-four receiving the DSP rather than the age pension. And close to 10 per cent in the growth in numbers of recipients on the carer payment is accounted for by this age group.
Chart 8: Percentage of women aged sixty to sixty-four years receiving the DSP, age pension or other income support, Australia, 1995–2013
Source: Calculated from Department of Social Services, Income Support Customers, A Statistical Overview, various years; ABS, Australian Demographic Statistics, June 2013.
In future, these two major pressures on the DSP numbers – the ageing of the baby boomers and the increase in women’s pension age – won’t operate to the same extent. Because the last of the baby boom generation turned fifty in 2013, the pressure on the DSP numbers should have started to lessen. The younger part of the baby boom generation won’t turn sixty-five until 2028, but the rate of increase will slow because that age group is not growing as rapidly. In the United States, for similar reasons, both the Social Security Administration’s actuaries and the Congressional Budget Office project that spending on the US disability insurance program will fall as a share of GDP in the coming decade as baby boomers convert from disability to retirement benefits and are replaced in the peak disability-receiving ages by smaller cohorts. If anything, the effect is likely to be even stronger in Australia because the increase in the pension age for women was also fully phased in by 2014 and this pressure will also decline.
It is worth remembering, however, that the Rudd government announced an increase in the pension age for both men and women from sixty-five to sixty-seven years, to phase in between 2017 and 2023. Some of the people affected by this change will probably be entitled to the DSP, leading to an increase in numbers on the DSP after 2017, but past experience suggests that the overall number of people in this age group receiving payments will reduce.
In addition, the 2010–11 budget included revised access procedures for some DSP claimants, to commence on 1 January 2012, and new participation requirements from 1 July 2012, affecting current and new DSP recipients under the age of thirty-five who are assessed as having a work capacity of eight hours or more a week. As shown in Chart 9, these changes appear to be associated with a very large slowdown in the rate of increase in the number of people being paid the DSP, albeit after a relatively large spike in numbers following the GFC (after a lag).
Chart 9: Annual average percentage change in the number of people receiving the disability support pension, Australia, 1995–2015
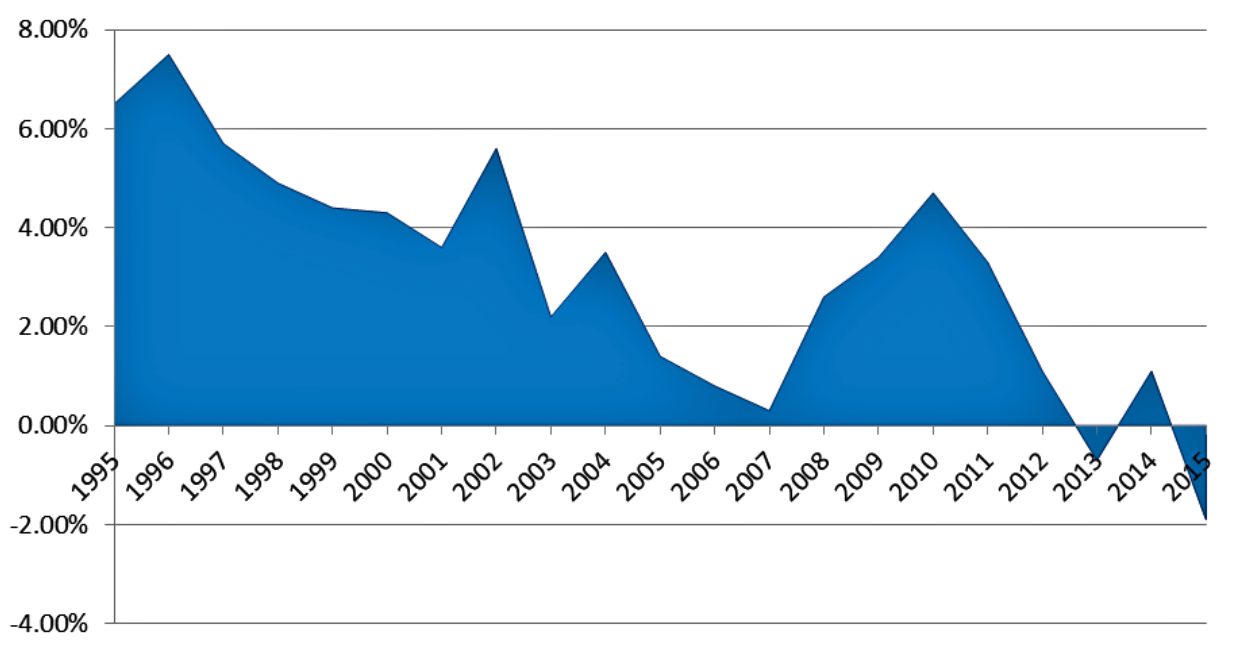
Perhaps as a result, the most recent figures for numbers on the DSP show a fall from around 827,000 in 2012 to 814,000 in 2015; excluding people over sixty-five who receive the DSP this is a fall to around 5.2 per cent of the working-age population, about the level it has been since 2002.
“Dependency” payments
What explains the reduction in the number of people receiving payments other than DSP, the carer payment or Newstart?
Starting in the 1980s and continuing for more than twenty years, the federal government began phasing out a number of other payments or limiting access to new claimants. Access to Widow B pension, for example, was limited in 1987, and then closed to new entrants in 1997. In 1994, the government introduced the partner allowance to provide support to the partners of beneficiaries who had previously received a “married rate” of payment; then, in 1995, it restricted this to older women without recent workforce experience while introducing Parenting Payment Partnered for partners with dependent children. As well as phasing out these payments, the government changed the income test for unemployment payments in 1995 to require both individuals in a couple to claim the benefit in their own right, and part of their individual earnings did not affect their partner’s benefit entitlements.
The wife pension was closed to new entrants in 1995; the partner allowance and the mature age allowance were closed to new claimants in 2003; and by 2008 there were no longer any recipients of the mature age allowance. Since 2005, new grants of the widow allowance have been limited to women born on or before 1 July 1955.
Most of these payments had effectively been based on the assumption that women were “dependents” of men, or in the case of widows that they had been dependent and should not be expected to look for work. Even the lower age for women to receive the pension had been partly based on the assumption that women would want to leave the workforce at roughly the same time as their assumed older husbands. Economist Bob Gregory has also argued that these changes affected the likelihood of partnered men claiming payments, because their behaviour could be influenced by their partner’s failure to qualify for a payment.
These changes had a profound impact not only on the total number of people receiving welfare payments but also on which payments they received. In the mid 1990s, the “closed payments” – mainly for women – were received by around 4 per cent of the working-age population; now, only 1 per cent of the population receive their successor payments.
About 1.3 per cent of the working-age population are receiving the carer payment. As with the age pension/DSP trade-off for older women, the rise in the number of people on the carer payment is more than offset by the decline in the number of people on these “dependency” payments.
A further change to parenting payments by the Howard government in 2006 required new lone parents with a youngest child aged eight or over to claim Newstart rather than parenting payment single and for partnered parents with a youngest child aged sox years and over to claim Newstart rather than parenting payment partnered. Parents already receiving the benefits, however, were “grandfathered” and continued to receive these higher levels of benefit.
What about the unemployed?
Two main factors have driven the growth in Newstart numbers. The number of people receiving unemployment benefits tracks broader labour-market trends fairly closely, and so the increase in the unemployment rate from around 5 per cent to closer to 6 per cent since June 2012 could be expected to result in roughly 100,000 additional people on benefits.
Changes to the DSP under the previous government, which appear to have slowed its growth, may have increased numbers on Newstart, while policies designed to shift people from parenting payments to the lower Newstart payments since 2006 (and particularly since the beginning of 2013) have also added to the total.
The Gillard government forecast that around 10,000 people would lose all entitlement to benefits in 2013 as a result of the decision to move the “saved” lone parents from parenting payment single to Newstart, and that around 75,000 would transfer onto Newstart. (This effect is the same as the substitution between the age pension and the DSP, carer payment and other closed benefits, as described above.)
The monthly statistics on labour force payments show that between December 2012 and February 2013 the number of people on unemployment payments jumped from around 700,000 to 796,000, an increase around four times as great as the corresponding periods for the previous two years. Moreover, around 83 per cent of the increase was made up of women, reinforcing the impression that this very large jump is mainly explained by parents transferring from parenting payments.
The table below shows trends in the number of lone parents receiving either the parenting payment single or Newstart between 2006 and 2014. From a negligible number of lone parents receiving Newstart in 2006, the number has grown to around 120,000 in 2014. Data on the number of lone parents receiving other payments such as the carer payment or the DSP are not publicly available, and it is possible that a sizeable number of people who would otherwise have received the parenting payment single would now be receiving one or other of these payments, if they were eligible. Nevertheless, Table 1 shows that while Newstart numbers have grown significantly, the total number of lone parents receiving one or other of these payments has fallen.
Number of lone parents receiving either parenting payment single or Newstart, Australia, 2006–2014
Source: Data provided by ACOSS from answers to Parliamentary Questions on Notice
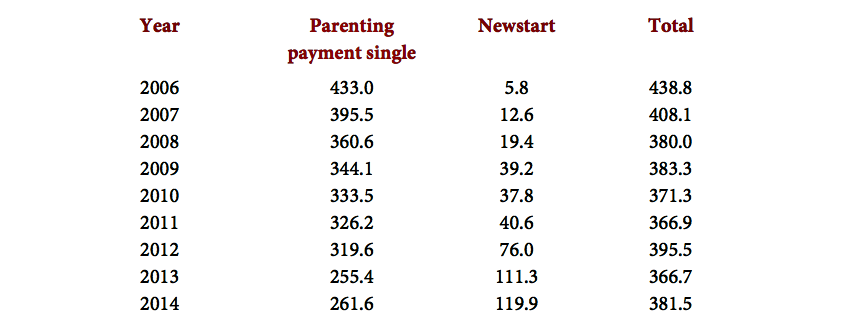
Chart 3 showed that the share of the working-age population receiving Newstart has risen since 2008, with about 300,000 more people on Newstart in 2014 than just before the GFC. In 2014, as Table 1 shows, there were about 100,000 more lone parents on Newstart and 100,000 fewer on parenting payment single than in 2008, and as suggested earlier a rise in the general unemployment rate by 2 percentage points could have been expected to add around 200,000 more people to Newstart.
While the situation is complicated by other changes in the population – including a fall in the number of lone parent families since around 2003 – these figures suggest that a very significant component of the rise in numbers on Newstart can be explained either by labour-market change or deliberate policy change.
What has happened to spending?
Not surprisingly, governments interested in balancing the federal budget are most concerned with program spending, even if the number of recipients is one of the main drivers of aggregate spending. Governments also tend to focus on nominal spending over the forward estimate period.
Just as it is preferable analytically to focus on recipients of benefits as a percentage of the population, it is also preferable to treat spending as a percentage of GDP as the best measure of the affordability of the system. This is because, as we’ve seen, real spending will grow simply as a result of population growth, even if all other parameters are held constant.
The most consistent and comprehensive time series on social spending as a percentage of GDP can be found in the OECD Social Expenditure database, which provides overall levels of public social spending up to 2014, though details of spending disaggregated by program are available only to 2012. (The social spending figures for Australia aggregate federal and state government spending, but virtually all spending on cash benefits is undertaken at the federal level.)
Chart 10 shows trends in spending on age and related pensions (mainly DVA payments) from 1995 to 2012. With the exception of the year 2000, spending on age and related pensions has remained between 3 and 3.4 per cent of GDP. (The spike in spending in 2000 is the result of the compensation package for the introduction of the GST in that year.) These pensions are indexed to wages, so the stability of spending as a per cent of GDP is likely to reflect the declining coverage of the service pension, as discussed earlier.
Chart 10: Spending on age and related pensions, Australia, 1995–2012
Source: OECD Social Expenditure database.
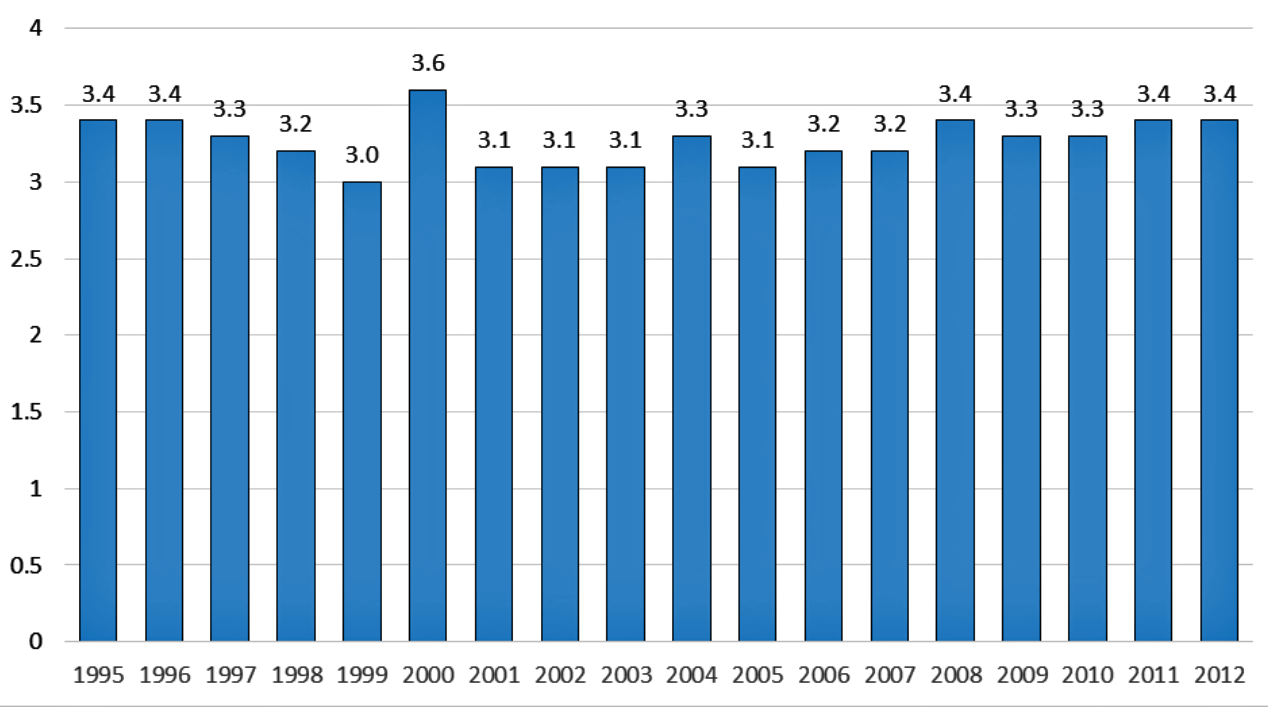
Chart 11: Spending on working-age cash benefits, Australia, 1995 to 2012
Source: OECD Social Expenditure database.
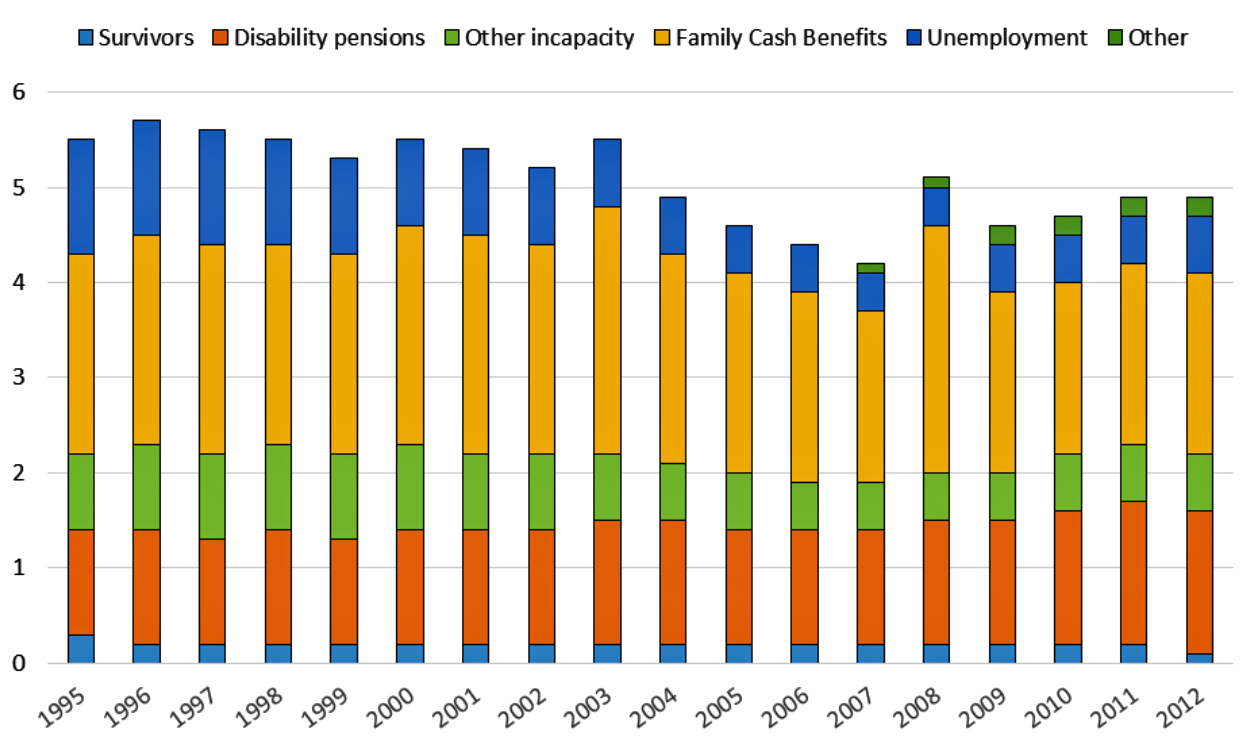
Chart 11 shows trends in spending on the other major cash transfers from 1995 to 2012. Overall, spending has fallen from 5.5 to 4.9 per cent of GDP over this period. Spending on working-age payments spiked in 2008, at the time of the stimulus payments made during the GFC. Excluding “other incapacity” (mainly state government workers’ compensation payments) overall spending fell from 4.7 to 4.3 per cent of GDP.
Spending on the unemployed – which includes spending on parenting payments in the OECD’s definition – fell from 1.2 to 0.6 per cent of GDP. The only component to rise as a percentage of GDP was disability payments (which include the carer payment), from 1.1 to 1.5 per cent of GDP.
Spending on family cash benefits rose substantially from 2.1 to 2.6 per cent of GDP between 1995 and 2003, but has since fallen back to 1.9 per cent of GDP (although with a spike at the time of the GFC).
Overall, the spending trends in the OECD data are consistent with the picture derived from considering trends in the number of recipients. Spending has gone up in some categories, notably the DSP and carer payment, but spending in other social security areas has fallen to more than offset these rises.
Where to from here?
The data show a prolonged fall in the number of welfare recipients since the mid 1990s, reflecting a long period of economic growth, a strong labour market, and the positive impact of policy changes since the early 1990s. While trends have not been as positive since 2008, they have been mild by the standards of earlier economic downturns in Australia. Trends in spending as a per cent of GDP show broadly similar patterns, with no evidence of major increases after 2008.
This analysis also shows that past trends are not necessarily a reliable guide to the future. The two main pressures on DSP numbers – the ageing of the baby boomers and the increase in women’s pension age – are unlikely to continue to have such a significant impact, suggesting that numbers of recipients and levels of spending relative to GDP are unlikely to grow in the near future unless there is some form of economic shock.
While concerns about relentless growth are difficult to substantiate – particularly when the total number of welfare recipients is close to its lowest level in the past twenty years – we should not be complacent.
Our main concern should be to avoid any significant blow-out in unemployment. Previous increases in unemployment in the recessions of the 1980s and 1990s had very long-term consequences, particularly for jobless families with children. Nor should we be complacent because welfare numbers are at their second-lowest level in the past two decades. Successive governments have argued that the “best form of welfare is work” and it is clear that the economic wellbeing of individuals and families is much greater in paid work than outside it.
The problems that some people on welfare face in moving into work require a comprehensive analysis, however. Not all these problems are caused by the welfare system: other barriers to work include labour-market programs that are not equally effective for all, a lack of job opportunities in the regions where people live, poor public transport, inadequate and expensive child care, mismatched skills, and negative employer attitudes to people disadvantaged in the labour market. Changing incentives in the welfare system through reform of eligibility for specific payments is only part of an effective response to these challenges.
In addition, the growth in the size of the population aged sixty-five and over will put upward pressure on spending over coming decades. Preparing for the continued ageing of the population, however, does not necessarily imply that the solution is to seek to further cut spending on working-age payments. •