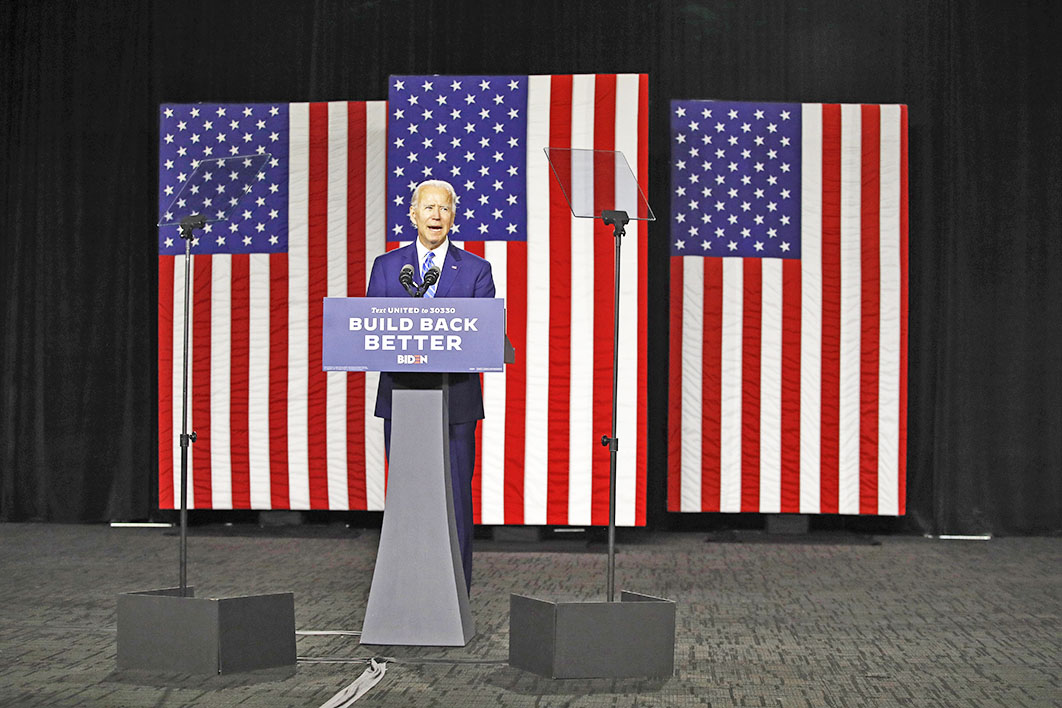
A presidential election is due soon in a far corner of the globe you might just have heard of. US Democratic contender Joe Biden is comfortably ahead of president Donald Trump in the polls, with a lead averaging about 9 per cent.
Is 9 per cent a lot?
In the Australian vernacular we’d be talking about an anticipated 54.5 per cent two-party-preferred vote for one side and 45.5 per cent for the other, which would certainly qualify as a landslide. We last saw one that big when Malcolm Fraser was re-elected in 1977. (1975 was even bigger, 55.6 to 44.4.)
If I were writing this in early November, on election eve, we could be pretty sure that Biden would be the next president. But maybe not as certain as we might once have been, because of recent high-profile poll fails. And remember also that Trump won the presidency in 2016 despite losing the national vote by 2.1 per cent. In uniform swing terms he did it with a 0.7 per cent buffer: anything less than 2.8 per cent would been enough to clinch an electoral college majority.
(A homegrown equivalent was John Howard’s 1998 re-election with 49 per cent of the two-party vote to Labor’s 51. Assuming a uniform swing, the Coalition could have survived with seventy-five out of 148 seats had it received just 48.3 per cent of the vote — a 3.4 per cent loss to Labor’s 51.7.)
FiveThirtyEight estimates that Trump’s likely electoral college advantage in 2020 is a bit bigger than last time, although that may be shrinking. If we conservatively assume it’s 2 per cent, that effectively whittles Biden’s lead to 7 per cent.
Have opinion polls been out by 7 points recently? You bet. Remember, we’re talking in terms of one side’s lead; every per cent that moves from one major candidate to the other increases the gap by double that. So, yes, polls have made mistakes of similar magnitude many times, and not just recently.
A polling mistake makes headlines when (a) the election is high-profile, in a high-profile country, like America or the United Kingdom, or in one’s own country, and (b) the error makes a difference to the win–lose outcome.
In Victoria in November 2018, the final polls had the Andrews government easily ahead on 53 or 54 per cent after preferences, but the result came in much bigger at 57.3. A predicted win by 6 or 8 became 14.6 percentage points. Yikes, how embarrassing. Luckily the right side won. Also, no one outside Australia was paying attention.
But in lead terms they missed by about 7 per cent.
Brexit in 2016 was watched the world over. The final polls averaged to around 51–49 in Remain’s favour. It ended up 51.9–48.1 the other way, a 6-point turnaround. A slightly better performance (with many more polls) than Victoria, but the “failure” reverberated across the globe.
At our last federal election, in 2019, final polls were out by about 3 per cent, predicting around 51.5 per cent for Labor when the result was 48.5 — another 6 per cent turnaround.
All of those examples were election-eve failures. But we are more than three months away from this election, which is a long time in survey land. Have past American presidential election results moved by 7 points or more in that final hundred days? Certainly; many times.
Part of the problem is that the picture is muddied by both parties’ national conventions, where they formally nominate their candidates. These highly choreographed affairs last several days and are supposed to generate a “boost” in the polls, and usually do. (Whether “boosts” are sustainable or usually fleeting by nature is another topic.) They are usually held in July or August, but sometimes in September.
In 2020, because of Covid-19, both conventions are late, and will be shadows of their former selves.
So, after hours of research (or maybe a quick visit to Wikipedia), I compiled a table of presidential election-year polls from 1936 (when the Gallup method of random sampling became de rigueur) to 2016. The biggest July to November change on record was in 1976. The only July poll, taken after the Democrat convention, had Jimmy Carter at more than double the incumbent, Gerald Ford, 62–29. The election-day victory was by a modest 2.1 per cent (the Republican convention was in August), a 31 per cent collapse in Carter’s lead. Obviously that dwarfs Trump’s challenge.
The 1988 Democrat collapse was also spectacular, with Michael Dukakis going from an average lead of 11.5 in July to a 7.8 per cent loss, a 19-point turnaround that would obviously see the Donald romp home. Again, conventions played a part. (Dukakis’s ill-fated tank stunt took place in September, after the Republican convention, when George Bush had already taken a sustained lead.)
And the biggest July to November gain for a Democrat — or drop for a Republican — was in 1936.
Let’s narrow it down to elections at which a president is seeking another term. Incumbent Barack Obama made a modest 3-point gain in 2012 against Mitt Romney, and George W. Bush did the same against John Kerry in 2004. Hullo, do we have a pattern? Sadly, no, because in 1996 Bob Dole made substantial gains from mid-year. In fact Bill Clinton’s eventual 8.5 per cent win was smaller than any opinion poll since January that year.
And in 1992 the self-described comeback kid’s November achievement looks impressive compared with June (a gain of 17 points) but not July, after his convention boost.
Ronald Reagan (1984) gained 6 points, Richard Nixon (1972) went up by 4, while Lyndon Johnson in 1964 lost ground 9 points against Barry Goldwater. (The famous “Daisy” advertisement was released in September; no evidence to support the received wisdom that it was crucial to the outcome can be found in these published polls.)
How about 2016, Hillary Clinton’s shock loss? The gap change between July and November rounds to zero. That is, Clinton led by an average 2 per cent in July, and that’s what she won by in November. The election-eve polls generally had her ahead by around 3 per cent, which is nothing to be ashamed of compared with 2.1. Had it translated to an electoral college win no one would have blinked an eyelid. Crucially, the pollsters did fail in a few states.
But all elections are different and, as with much of the Trump presidency, this one is particularly so.
What can be said is that Biden’s lead is sustained and largely reflects a big swing among college-educated whites. But cohorts have been known to flirt with one side in surveys only to return to the fold as the big day approaches. (In Australia during the Howard years, women repeatedly polled well for Labor in Newspoll before moving back to the government by election day. Queensland almost always overperforms for Labor in the surveys compared with the ballot box.)
Will those small-c conservative Republicans and Independents actually vote Democrat when push comes to shove? At the time of writing Trump has just delivered one of those press conferences (on Covid-19) where he impresses the beltway by following the autocue and saying only sensible things. Almost like a normal president.
Has he the discipline to maintain such behaviour? Would it be enough to bring back those “rational” Republicans? Would it leave his base unimpressed?
There are still three months to go. What can be said other than that Biden will probably win, but Trump might? •