I NEVER thought I’d say this, but I’ve become a fan of the My School website. You’ll remember My School: the federal government launched it with great hype in 2010, promising greater school transparency and responsiveness, and it garnered millions of hits from the public. Alas, the first website was almost fraudulent in its claims, but recent versions show real promise – and it could get even better if it begins to use a greater variety of school achievement measures.
The winning feature of My School is not so much the way it enables accurate comparisons between individual schools – it doesn’t. But the data behind the site, covering such things as school size, funding, enrolment composition and student attendance, really do allow us to see how groups of schools compare, and how they may be changing over time. The most valuable feature is the measure of the socio-educational make-up of each school’s enrolment, the Index of Community Socio-Educational Advantage, or ICSEA. When we need to track the way our schools are progressing, or regressing, this measure is gold.
This year we’ll see the launch of My School version 5.0, which will allow us to track changes over time on measures including enrolments, social make-up and funding. But we can already use data from My School alongside other long-run information to find out more about schools, test hypotheses, track trends and paint future scenarios.
Here’s one example. For some time I’ve pointed with alarm to the growing social and academic divides between schools. There’s nothing new in that observation, and I’m in good and growing company – though my concern might be more keenly felt because it is derived from decades of working in, and leading, schools. To restate the problem: the concentration of advantaged kids in some schools – kids whose backgrounds mean they tend to be higher-achievers too – and disadvantaged kids in others is leaving the less-advantaged with fewer role models, diminished opportunities and poorer school results, and these are affecting student engagement, retention and achievement. We pile achievers together in some schools that are seen to succeed, and we leave other schools to bleed.
This underpinning equity problem that blights our schools was well documented in research completed for the Gonski review, and was prominent among the review’s findings. “Increased concentration of disadvantaged students in certain schools is having a significant impact on educational outcomes, particularly, but not only, in the government sector,” said Gonski. “Concentrations of students from low socioeconomic backgrounds and Indigenous students have the most significant impact on educational outcomes.”
The discussion of inequality in education often focuses on the differences between public schools and independent (non-Catholic) schools. But a closer look at the changing academic profile of government and Catholic schools suggests that growing inequality is occurring within all categories of schools.
On this point, the data isn’t as easy to find. NAPLAN data has only been published for a few years and inevitably tells us as much about home background as it does about what schools achieve. Higher School Certificate results might tell a story about school achievement, but consistent long-term information from the HSC and its equivalents in various states is not readily available.
The best information seems to come from Victoria, where for some years the Age has published comprehensive Victorian Certificate of Education, or VCE, results. The data spanning 2003–11 shows the school-by-school distribution of high-end academic results, represented by VCE study scores over forty.
How have Victorian secondary schools fared since 2003, grouped according to My School’s ICSEA measure and tracked using the Age data? Across the state, 368 larger secondary schools ran VCE classes in both 2003 and 2013, a span of eleven years. (Additional schools opened and a handful closed over this time, but we’ll focus here on schools with VCE candidates across the entire period.) To reduce the impact of year-by-year fluctuations, I haven’t included schools with an enrolment of fewer than 250 students in this analysis. I’ve divided the schools into four groups, based on their 2012 ICSEA values, and made the reasonably safe assumption that the socioeconomic profile of each school’s enrolment won’t have changed significantly over the previous eight years.
As the chart shows, only the highest ICSEA schools, the ones with the most advantaged students, increased their percentage of high scores – by just under two per cent – over the eleven years 2003 to 2013. In the other three groups of schools, the percentage of high scores fell between those years, with the larger falls experienced in the lower ICSEA schools. The percentage of high VCE scores in the lowest ICSEA schools, already low in 2003, fell by around 30 per cent over this period.
When measured year-by-year across these schools, some of these changes might seem small, but they are certainly noticeable and consistent over eleven years. There is not only a strong association between socioeconomic status and school achievement – nothing new in that – but it’s also the case that the higher achievers are increasingly found in the higher socioeconomic status schools. It seems the students have moved and taken their scores with them. The hollowing out effect on lower ICSEA schools is very obvious over time.
Where are Victoria’s Year 12 high achievers?
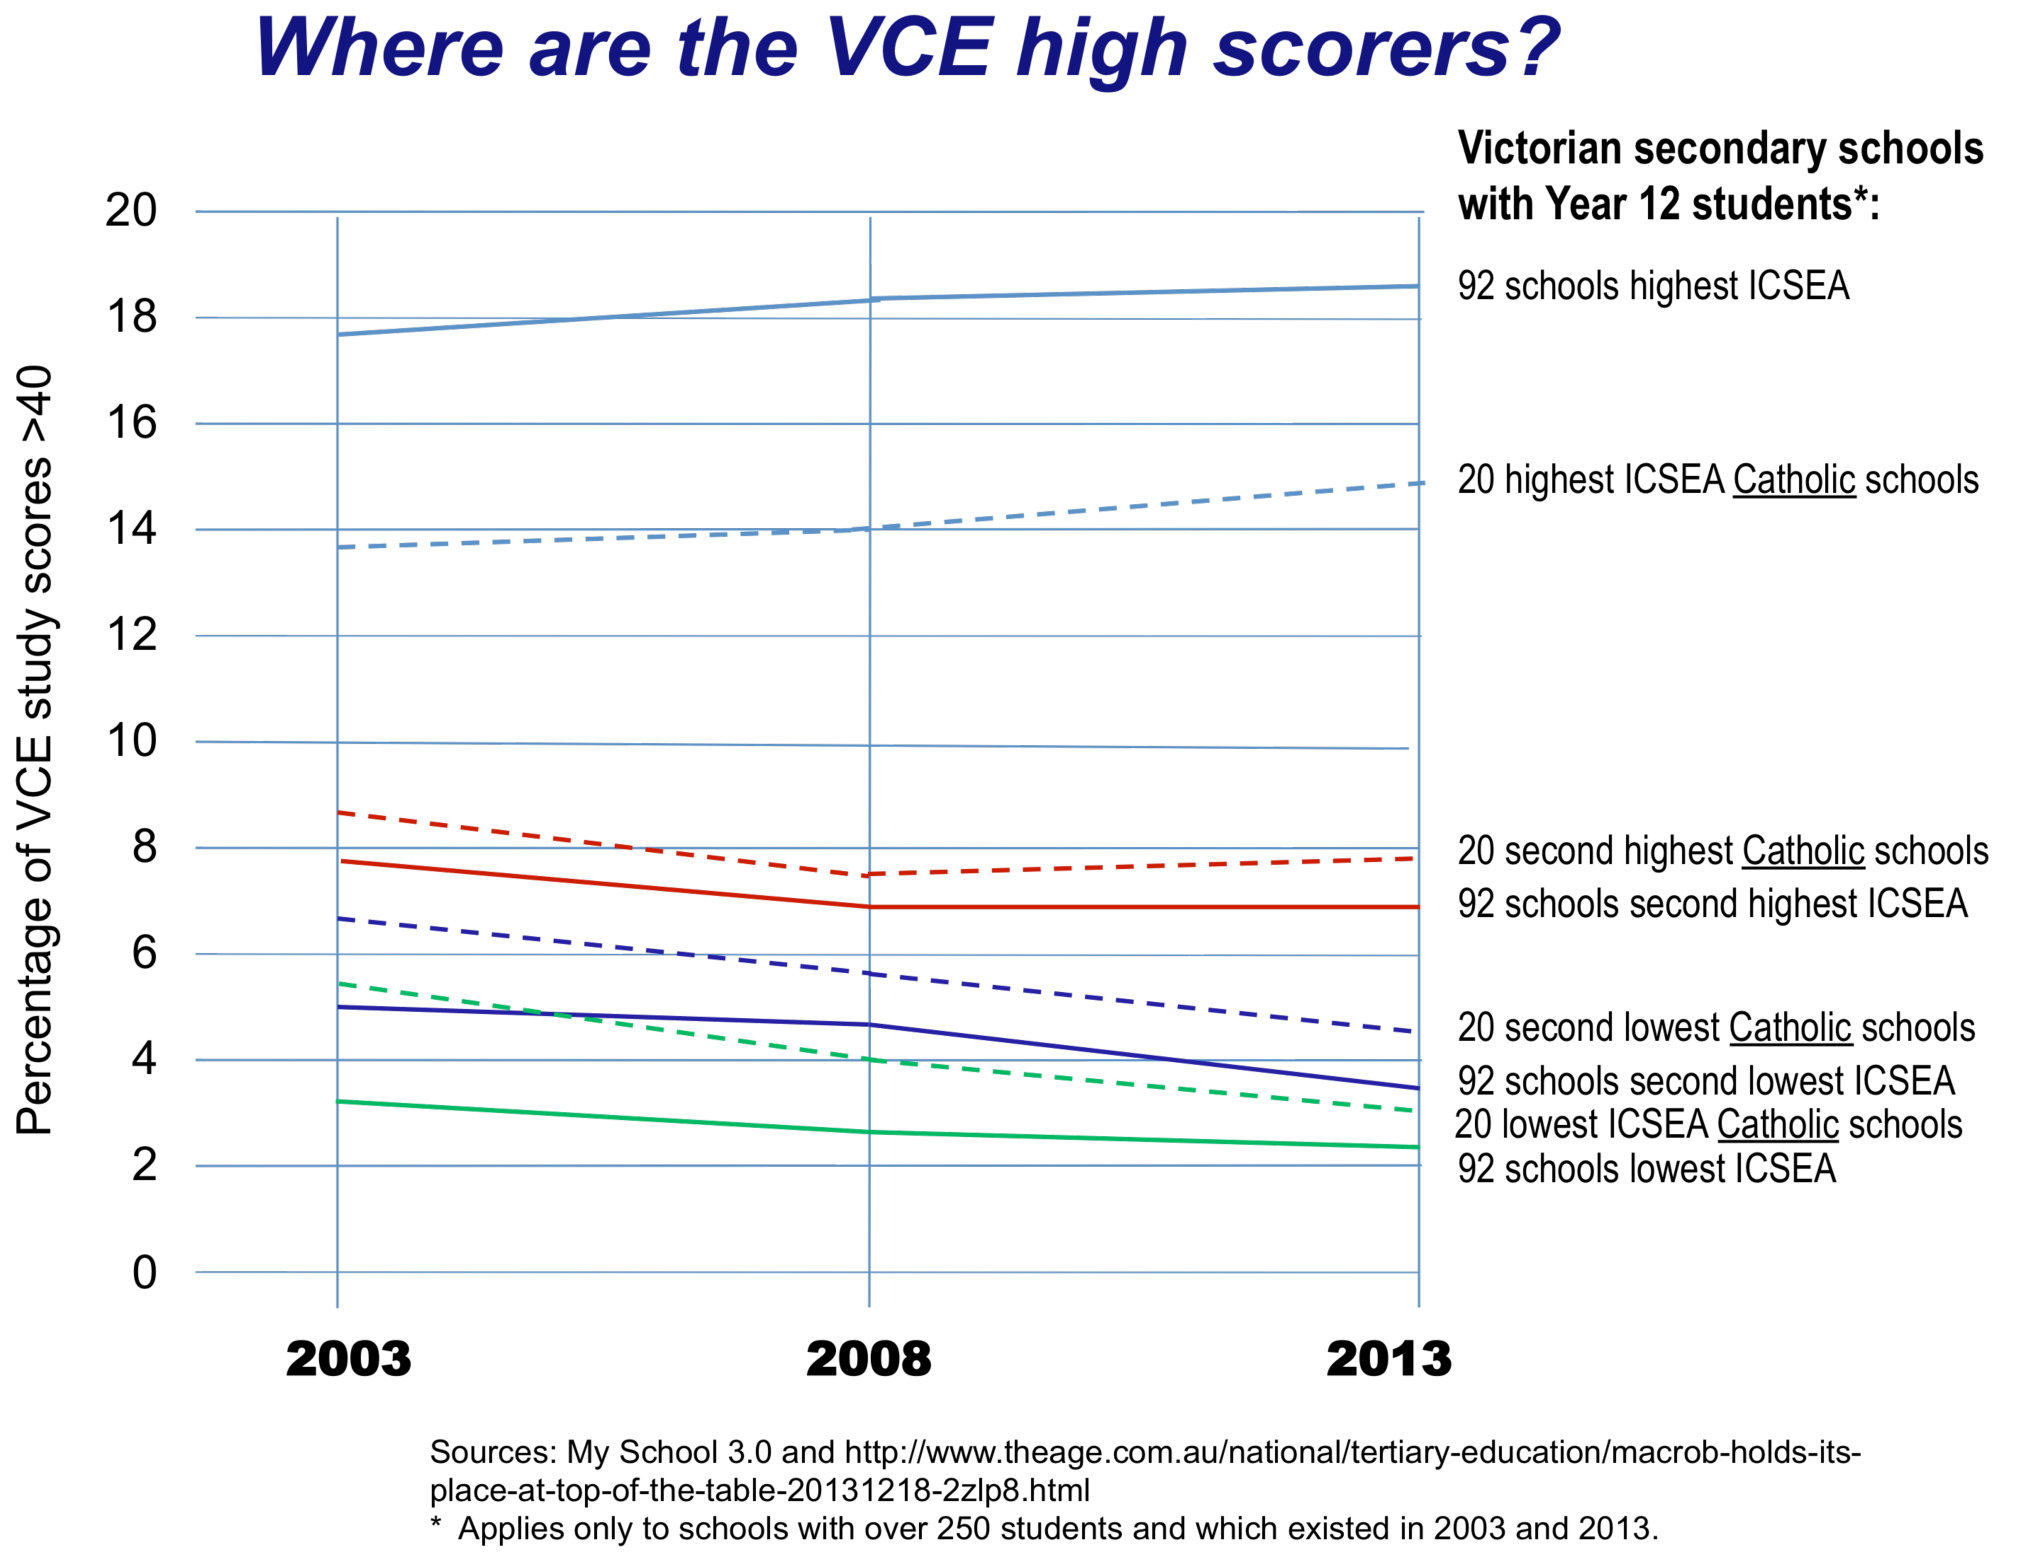
* Applies only to schools with over 250 students which existed in 2003 and 2013.
Sources: My School 3.0 and the Age.
Extra complexity becomes evident when the changes are considered in two stages, 2003–08 and 2009–13. The third-highest ICSEA group of schools lost some ground in the first period but the decline rapidly increased in the second. These schools may have initially held ground by picking up achievers from lower socioeconomic status schools, but such gains have apparently been fewer in recent years. The schools with the lowest ICSEA substantially lost their share of high achievers in the earlier period. That trend continued in recent years, but at a lower rate. Perhaps they had fewer aspirant and mobile students left to lose.
Can such trends be explained in terms of public–private drift? Not if the performance of Catholic schools, again evident on the chart, are any guide. The sample is smaller (eighty schools divided into four ICSEA groups) but these schools mirror the general trend. The higher ICSEA Catholic schools increased their share of high achievers and the lower ICSEA Catholic schools show an even sharper decline than all schools.
Independent schools are not shown on the chart. The bulk of independent schools are in the higher ICSEA ranges and they gained a slightly higher academic profile over the whole period. But the number of lower ICSEA independent schools in Victoria is too small to allow meaningful conclusions, beyond the fact that advantaged students have gravitated to these schools as a whole. My School shows this for almost every community in which independent schools are located.
On average, government schools lost more ground than did other sectors, but there were and are many more government schools in the lower ICSEA ranges. With some exceptions, they are the only schools obliged to enrol all students, regardless of family background and level of prior achievement. As My School shows, even in poor communities the more advantaged students are rarely numerous in government schools.
The figures also reveal several other trends:
• The decline in high VCE scores was much more noticeable among the provincial schools than among the metropolitan schools in the period 2003–13. This might be because the growth of non-government secondary schools, and their impact on existing schools, has been more recent in provincial areas.
• Smaller schools tended to lose more high scores over the whole period.
• The percentage of Indigenous students in school enrolments, a measure of disadvantage, was greater in schools with lower ICSEA values and a falling share of high VCE scores.
WE HAVE long known that more advantaged students have drifted away from schools faced with higher levels of disadvantage. Richard Teese and Stephen Lamb have described how this movement typically reduces the number of students attending individual low-ICSEA schools, increasing their proportion of disadvantaged students. It is hardly surprising that test scores such as NAPLAN, VCE or HSC are continuing to reveal the impact of this movement. From other evidence, we also know which students have shifted to non-government schools, most recently amply illustrated in research by Barbara Preston.
Less is written about the shift of enrolments from lower to higher ICSEA government schools, something which has almost certainly contributed to size differences between the schools. My School shows that high-disadvantage schools with Year 12 students in Victoria are typically 20 per cent smaller than high-advantage schools. A decline in the size of low socioeconomic status schools is also evident in New South Wales.
There are certainly exceptions to the trends. Governments, education systems and media often point to lower ICSEA schools that seem to defy the odds. Some exceptions may be explained by school improvement but many other factors are at work. Enrolment selection practices can be applied very subtly by schools, including high-demand public schools. Other schools might be able to hang on to their higher-achieving students because students have few alternatives: in a previous article for Inside Story I showed how around half of the higher-achieving public schools in provincial Victoria fall into this category. They may be good schools, but their great advantage is that they aren’t losing too great a number of high achievers to competing schools. Many schools in rural Australia have been fortunate to escape the claimed benefits of school competition.
These figures highlight once again the fact that we have created a very significant problem in our schools. If the trend in Victoria is representative, more than 400,000 students attend around 700 low-ICSEA secondary schools across Australia, students who are struggling in increasingly marginalised schools. Some people might find comfort in evidence that the loss of high achievers from low ICSEA schools might be slowing, but it is a small comfort: after cutting, even bleeding doesn’t go on forever.
Many of these 400,000 begin school already far behind. They may sit in classrooms devoid of the student role models found in the schools of their parents’ era. In worrying numbers they drift away from school before the end of Year 12. Overwhelmingly, their teachers are committed, but they tend to be inexperienced, and turnover is high. Their schools are usually close to the bottom of any achievement rank, and often cop criticism or pious but ineffectual handwringing. Their communities have lost much of the cultural capital essential to the future success of their children.
So do we continue to dabble in superficial solutions for our fractured and hierarchical arrangement of schools? Or do we try to improve opportunities for our poorest students and families by boosting their schools – and national achievement levels?
The first option is no solution at all, yet it is likely that we’ll continue with decades-old policies that have made little, if any, difference: centralising curriculum with more mandates, running manic testing regimes, comparing schools and shaming those labelled as poorly performing. We’ll combine this with the occasional distraction, such as Julia Gillard’s short-lived infatuation with performance pay and Christopher Pyne’s recycling of the curriculum culture wars. Other policy initiatives, such as creating independent public schools, will worsen equity by hanging the less powerful schools out to dry.
What could happen in the immediate future is that the Abbott government, under the banner of saving money, might try to truncate the My School website. After all, there is less of a problem if it can’t be measured.
Then again, who knows? After another decade of mounting personal and community costs created by a growing underclass of low achievers, perhaps someone will suggest a wide-ranging review to discover and recommend what should be done to resolve this equity and achievement crisis. The review could recommend policies on how to establish, fund and sustain quality schools for all students. It could initiate an inclusive and exhaustive consultation process and commission groundbreaking research. It could produce findings and recommendations that would be accepted and applauded by the whole education community. And it could receive bipartisan political support and an agreed commitment to action.
But that is what we have done, of course, except for the very last step. As time passes, the potential for the recommendations of the Gonski review to slow and even reverse the depressing trends described in this article are rapidly fading. The funding that could have lifted our lowest ICSEA schools won’t be found beyond the first four years and won’t go to the schools in greatest need. The states, ever willing to cut school funding, won’t be required to contribute their share for public and low-ICSEA schools.
As we head into a new school year it is becoming increasingly obvious that once again we’ll have to gather and publicise the evidence of a problem that is not going away, while campaigning for the solutions that came so tantalisingly close. •