WAGGA WAGGA in the Riverina region of New South Wales is a typical large regional centre, resembling both rural and urban Australia. Just as they do elsewhere, students go to school each day armed with their packs and books and computers – ready to learn, socialise and play.
But they’re equipped with much more than can be found in their packs. Some of them come from houses where books and learning hold pride of place, where parents have a post-secondary education and a well-paid job. In other houses the parents find each day more of a struggle and the longer-term goals of education are far more elusive. When students walk in through the school gate each day some of them are already well ahead of the others.
Their personal and family characteristics are now measured and displayed, school by school, on the My School website in the form of the Index of Community Socio-Educational Advantage, or ICSEA. The students who go to The Riverina Anglican College are the most advantaged secondary students in town. The ICSEA for the school’s enrolment is 1122 – higher even than most Anglican schools, which average just under 1100 at secondary level. Those who go to Mount Austin High School are the most disadvantaged – the ICSEA of their school is 861, well below the average of around 950 for public secondary schools. Wagga Wagga and its schools display the raw social contrasts found across Australia.
Despite the current interest in school funding – the federal government is conducting a Review of Funding for Schooling, of which more later – the differences among the secondary schools in Wagga Wagga are not directly created by financial or material resources. According to My School the total investment in students at The Riverina Anglican College is actually below each of the other secondary schools in the town. This story is about more than resources; it is about a hybrid mix of schools rife with contrasts in enrolment, resources, obligations and manner of operation. Many of its features are unique to Australia.
These contrasts can be seen in most communities. The seven secondary schools in Wagga Wagga (excluding one very small school with enrolments to year 9) form a social hierarchy, with The Riverina Anglican College at the top, followed by Mater Dei Catholic College, Wagga Wagga Christian College, Kildare Catholic College, Kooringal High School, Wagga Wagga High School and Mount Austin High School, in that order. The academic hierarchy is almost the same.
The ones towards the top charge school fees and can employ, either actively or passively, a range of other enrolment discriminators. The ones towards the bottom cannot do either, and their enrolment is quite different. Notwithstanding all the debate about school quality and family choice, the differences in the enrolment profiles of schools are what create the gaps between them. The enrolled students in any school are a critical collective resource that advantages some schools and students, and disadvantages others.
My School confirms our social and academic separation of school students. The OECD’s Programme for International Student Assessment, or PISA, suggests that this organisation of schools does not deliver quality and equity – the twin holy grails of education systems. Our current school system defies the evidence about successful practice, places an almost insurmountable barrier in front of low-achieving students, explains our worsening equity problem and doesn’t deliver high overall achievement for our schools – with all the social and economic problems that follow.
My School’s portrait of our schools
What does the My School website tell us about these problems? The website has had a brief but chequered history, some details of which are included in a previous Inside Story article. The website didn’t, and still doesn’t, tell us much about the quality of individual schools.
The first website provided a glimpse into our whole framework of schools; My School 2.0 provides much more. Whereas the first website’s ICSEA was a proxy measure, using Australian Bureau of Statistics data from census collection districts, the ICSEA used for My School 2.0 is mainly constructed out of information provided by parents. But the new ICSEA is still subject to errors and has further to go before it will accurately describe each school’s enrolment. The ICSEAs of schools with low socioeconomic status are almost certainly still inflated, and the ICSEA measure does not sufficiently account for variations between schools created by selection of enrolments.
My School has improved enough, however, to tell us a local and national story about our schools, even if the story varies according to who is doing the telling. In the weeks surrounding the launch of My School 2.0 we were variously assured that:
• Catholic schools are the nation’s cheapest
• public schools enrol more wealthy families than do independent schools
• high-fee schools aren’t delivering results to justify the fees
• small public and special schools cost more.
Researchers will inevitably crunch more My School data and consign such claims into categories ranging from the obvious through to the deliberately misleading.
But there is still much that My School does tell us – as long as we take care to describe associations rather than jump to conclusions about causes and effects. It shows that in most parts of Australia we certainly do have a social hierarchy of schools and that this is associated with a similar academic hierarchy, as illustrated for secondary schools across Australia in Figure 1. This hierarchy is more pronounced for secondary rather than primary schools and exists wherever there is significant choice of schools.
Figure 1: Social and economic hierarchies: ICSEA and NAPLAN
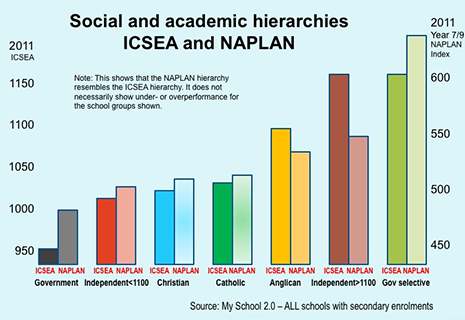
This graph alone challenges a raft of statements made about our schools. In May 2008 then education minister Julia Gillard said that “it is not really possible any more to generalise about any one school system as rich or poor because it is public or private. Some non-government schools serve some less affluent communities, and some public schools serve some more affluent communities.”
Both statements are misleading. When it comes to family backgrounds it has always been possible to make such a generalisation: the sector that must be open to all students and cannot charge fees will (unsurprisingly) enrol poorer students. Some of these schools do have more government funding per student, but it is a considerable leap to describe them as rich. To argue that “some non-government schools serve some less affluent communities” is misleading: My School shows that they manage to enrol the more advantaged families in the communities they serve.
The My School data suggest numerous associations. Some of these indicate that:
• higher ICSEA schools have higher NAPLAN scores and higher rates of attendance
• on average, government schools receive a net income (from all sources) of around $11,100 per student, Catholic schools $10,000 and independent schools $13,700
• per student capital funding from all sources is 66 per cent higher in Catholic schools than in government schools, and 140 per cent higher in independent schools than in government schools
• net income per student in government schools favours schools with lower NAPLAN scores, but net income per student in independent schools favours schools with higher NAPLAN scores
• for all schools, government funding is less for schools with higher ICSEA and NAPLAN scores – but private-source funding reverses the effect, especially in independent schools.
Much of this isn’t new and isn’t surprising, but it is displayed for all to see. To the above could be added associations between school income and teacher/student ratios, associations between ICSEA/sector and Indigenous enrolments, between location and ICSEA, and between location and NAPLAN. There are variations within sectors.
How did this happen? The role of funding
In light of these associations it is hardly surprising that the federal government’s current Review of Funding for Schooling has two critical features. The first is the inclusion of all schools and sectors and all sources of income available to schools. The second is the panel’s commitment to the view that “differences in educational outcomes should not be the result of differences in wealth, income, power or possessions.”
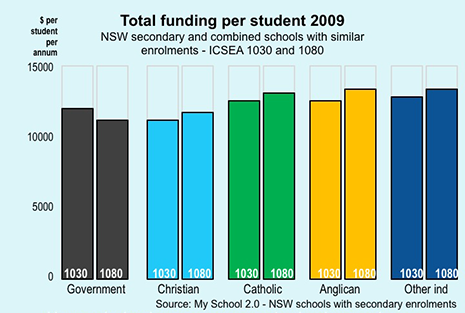
My School shows that governments allocate funding with the intention of supporting equity of outcomes. But the addition of private-source funding, mainly in the form of school fees, usually reverses the effect of the funding difference – with impacts on nearby schools. There is a serious disconnect between the outcome apparently sought by public funding and the outcome achieved after private-source funding is added. Figure 2 shows how total funding favours higher ICSEA schools for all except government secondary schools.
Figure 2: Total funding per student, 2009
As a single factor, different levels of investment do not necessarily create differences in student achievement outcomes. But the better resourcing of some schools over others has to be seen alongside the differences among schools in their obligations, especially their enrolment obligations, and the manner in which they are permitted to operate.
This combination of differences – to which should be added public and parental perceptions of particular schools and sectors – plays a key role in unevenly redistributing the critical resource of engaged and achieving students. It is this uneven distribution of students, particularly the pooling of disadvantaged students in low socioeconomic status schools, that has created the widening gaps in the social and academic profiles of schools. Outcomes for students in lower socioeconomic status schools and communities have worsened.
International perspectives
The decline in equity in Australia’s school system has happened as evidence, especially from the OECD’s Programme for International Student Assessment, or PISA, is starting to show which practices in the provision of schools are characteristic of high-performing countries, and which practices are not. Many of PISA’s findings bring into question the ways that we provide and support schools in Australia. While the achievement of Australian students compares quite well internationally, equity of outcomes falls short of that achieved in many comparable countries.
PISA’s 2009 report shows that successful school systems are those that perform above average and show below-average socioeconomic inequalities. Their schools provide all students, regardless of their socioeconomic backgrounds, with similar opportunities to learn. PISA reports should be considered alongside what My School is telling us.
These findings have implications for school and system achievement and for subsequent economic growth and competitiveness. There are also implications for the ways in which we may or may not be developing social capital and social cohesiveness. Some key points emerge:
1. My School shows that Australia has a differentiated system of schools. But PISA shows that systems that show high performance and an equitable distribution of learning outcomes tend not to be differentiated. They are more likely to be comprehensive, requiring teachers and schools to embrace diverse student populations.
2. The recent posting of school performance data on My School is partly driven by the belief that parents should have choice and that this choice is best informed by school performance indicators. Another OECD report, Markets in Education, states that choice of schools is overwhelmingly local and more strongly determined by the social hierarchies of schools created by their enrolment – performance indicators are less significant.
3. Current Australian government policy is to encourage schools to be more independent of system authorities, especially in school management. But PISA says there is no clear association between management autonomy and school system performance. There is an association between school system performance and autonomy for schools in areas such as curriculum and assessment – but autonomy in these areas is not being extended to Australian schools.
4. My School is partly driven by a belief that competition creates quality, but even where research shows a link between competition and quality it is variously described as being insignificant. Markets in Education reports that school systems where parents can choose a school risk increasing segregation of schools in terms of ethnicity, socioeconomic status and ability. It concludes that schools mainly compete by improving their position in the local social hierarchy.
5. PISA’s 2009 results show that schools with better resources tend to do better – but only to the extent that they also have more socioeconomically advantaged students. What this suggests is that material and financial resources play an important role in attracting a more significant resource: an advantaged enrolment. School fees not only partly pay for the resources but also act as an enrolment discriminator.
6. Supporting the above, PISA’s 2009 results show that, regardless of their own socioeconomic background, students attending schools with a socioeconomically advantaged intake tend to perform better than those attending schools with more disadvantaged peers. In the majority of OECD countries, the effect of the school’s economic, social and cultural status on students’ performance far outweighs the effects of the individual student’s socioeconomic background.
7. PISA reports that, after accounting for the socioeconomic and demographic profiles of students and schools, students in OECD countries who attend private schools show performance that is similar to that of students enrolled in public schools. It is the enrolment profiles that create the differences that dominate superficial debates about schools.
It is not unusual to find gaps between education policy and the evidence for its claimed benefits. As education leadership and policy specialist Ben Levin writes about school reform:
So much time and energy have been wasted on avenues that have turned out to be unproductive if not actually harmful. Many blind alleys have been pursued in the name of system improvement, but based on people’s a priori beliefs about how systems ought to operate.
Our excursions into some of these blind alleys can be increasingly demonstrated to be both unproductive and harmful.
A growing equity problem
My School displays our equity problem and PISA strongly suggests that our policy framework is not associated with high system performance – but are we getting better or worse?
The gaps between our schools are increasing. Using information from the 2006 and 1996 censuses, education researcher Barbara Preston has shown the changing ratio between low- and high-income families in schools. In 1996 there were an average of thirteen low-income for every ten high-income students in our public secondary schools. In 2006 there were sixteen for every ten. The opposite trend occurred in private schools.
In 2007, another education researcher, Stephen Lamb, illustrated an interesting trend in public schools by charting the changing size of schools in Melbourne following the implementation of Kennett government policies, especially dezoning. Lamb discovered that schools in lower socioeconomic status areas fell in size and were left with a larger proportion of high-need students. The disadvantage faced by these schools and their students was compounded as a result.
In “Big Town Blues” I outlined the divides that exist between schools in the larger regional centres in New South Wales. This work also showed that the larger and higher socioeconomic status secondary schools have held enrolments and increased their share of high-achieving students. Enrolment in the smaller and lower socioeconomic status schools has fallen, as has their share of high achievers. The number of private schools and their share of high achievers have increased.
A range of factors affect school size and growth or decline – including size of the drawing area and local demographic shifts, as well as genuine differences in quality and the impact of school leadership. But clearly something else is happening to consistently change the enrolment profile of the students being served by our schools. Some schools have seen their density of disadvantage increase, others have benefited from an increased pooling of advantaged students.
Let’s return to Wagga Wagga, one such regional centre, to find out how the schools there have changed over time.
The hierarchy of schools in Wagga Wagga, New South Wales
The social and academic hierarchy of secondary schools is certainly visible in this regional centre, where the schools are located in relatively close proximity. Figure 3 shows the relationship between ICSEA and NAPLAN for the seven schools mentioned at the start of this article.
Figure 3: Wagga Wagga schools with secondary enrolments – ICSEA and NAPLAN
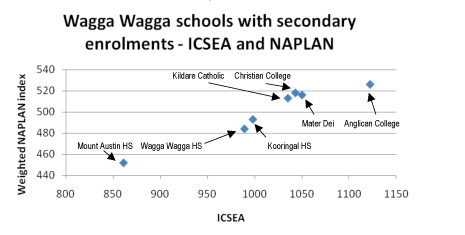
The differences among the government schools are quite noticeable. Wagga Wagga High and Kooringal High share similar NAPLAN scores and ICSEAs, but Mount Austin High has by far the lowest ICSEA and NAPLAN profile of all the Wagga Wagga schools. It has also considerably declined in size over the last two decades.
The distribution of Indigenous students is particularly noticeable. Figure 4 shows the proportion of Indigenous students in the enrolment of each of the local schools. Even though Indigenous families form eight per cent of the immediate drawing area of Mount Austin High, Indigenous students now make up 26 per cent of the school’s enrolment. The other two government high schools, less than three kilometres distant, are located in areas with an Indigenous population of between two and four per cent, but the enrolment of Indigenous students in these schools (five per cent) is much lower than at Mount Austin High.
Figure 4: Wagga Wagga schools with secondary enrolments – student background

The reasons for the apparent increased concentration of Indigenous students in just one of the schools may be quite complex, and there may be equally complex reasons behind the 41 per cent decline in the size of the school since 1995.
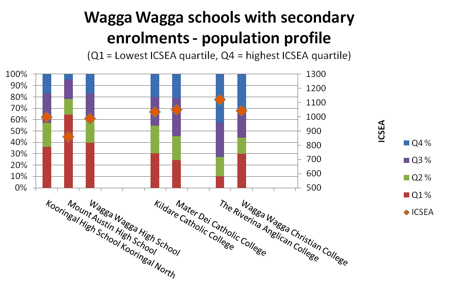
Figure 5 shows substantial differences among all the local schools with secondary enrolments. Only Kildare College has anything like an even distribution of students by socioeconomic quartile – Mount Austin and the Anglican College are almost a mirror reversal of each other. Together the schools form a very evident hierarchy.
Figure 5: Wagga Wagga schools with secondary enrolments – population profile
The alignment of the schools in this social hierarchy is also reflected in student achievement, including in HSC results. As illustrated in a previous Inside Story article these results can show changes over time. In 1995 two-thirds of the HSC high achievers in Wagga Wagga were enrolled in the government high schools. In 2007 just one-third of the local distinguished achievers in the HSC were enrolled in the same schools. By 2007 the higher ICSEA non-government schools had come to dominate this competition, some more than others.
What has created this hierarchy? It can’t be resources: even though there are oddities in the funding, Mount Austin High School has the highest total recurrent income per student, followed by the two Catholic schools, the two other government schools, the Anglican school and the Christian school. Nor does it seem to be a school quality hierarchy: when the enrolment profile is taken into account the schools at the top don’t seem to be demonstrably better than those at the bottom. While there are some variations – and allowing for the inadequacy of the measure – the test scores for the Wagga Wagga schools generally reflect the socioeconomic profile of each school’s enrolment, as seen in Figure 3.
The differences among the schools are essentially created by who walks through the front gate each day. The enrolment discriminators available to some schools more than others help construct these differences. The schools enrol very different students – and it shows.
Schools have a very uneven capacity to determine who does or does not enrol. The most overt discriminators are entrance tests – now used to part-select the enrolment at Kooringal High School – but scholarships, prior academic record, church affiliation and extended interviews are all discriminators. The enrolment form for Wagga Wagga Christian College runs to fifteen pages. The Riverina Anglican College, established in 1999, requires two referees, previous school reports, payment of various amounts (in addition to fees) and a parent interview.
Schools such as Mount Austin High, which cannot or will not apply discriminators, have a disproportionate enrolment of low-achieving students.
The most significant discriminator is the charging of fees at various levels – up to $5000 per student in Wagga Wagga. This hurdle immediately defines who gets a choice and which schools they can choose. Schools that charge fees inevitably snare a middle-class enrolment and they harvest everything else that comes with these students. This is even the case where fees are quite low – the term “low-fee school” is a misnomer in low socioeconomic status communities.
Institutional and legislative differences between schools are also important. By definition most public schools must be open to all. They cannot easily discriminate when it comes to this very significant input (and resource, as revealed below) – the enrolled students. Private schools have a range of accountabilities but they also have more flexibility in the extent of their obligations and in the manner of their operation – especially in hot-button areas such as enrolment, discipline and school uniforms. As the enrolment form for The Riverina Anglican College clearly shows, an enrolment can be terminated at the principal’s discretion.
The hierarchy of schools in Wagga Wagga has come to resemble that found in most urban areas: a hierarchy that has little to do with school quality, and much to do with variations in student opportunities and outcomes created by, in the words of the funding review, “differences in wealth, income, power or possessions.”
Students: a critical resource
My School suggests that the financial resources available to each of the schools don’t directly explain the between-school differences in student outcomes, and it doesn’t go close to suggesting which school practices make an impact. It illustrates instead how significant higher-achieving students are as a resource, and that they are distributed unevenly around the schools according to the income level of their parents.
The impact of students as a collective resource is illustrated in Figure 6, which is included in a new discussion paper, Australian School Funding Arrangements, prepared by the Department of Education and Training in New South Wales.
Figure 6: Year 9 students, NSW – average literacy and numeracy scores by student and school socioeconomic status quartiles

The broken lines show the average test scores for each quartile group of schools. The broken green line, for example, shows that the average literacy and numeracy score of Q1 (lowest quartile) schools is around 565. The green unbroken line shows how the average score of Q1 students varies according to the socioeconomic profile of the school they attend. It shows that Q1 students who attend Q4 schools will achieve at a significantly higher level, higher even than the average achieved by students in Q3 schools.
It shows that the Q4 students derive a considerable benefit by attending schools with higher socioeconomic status peers. In effect, a significant resource for learning is the enrolled students in the higher quartile schools. Conversely this collective “resource” in lower quartile schools acts to reduce student outcomes.
There are profoundly disturbing implications of this graph. In the words of the report:
What these graphs show is that there is a considerable “neighbourhood effect” with regard to SES [socioeconomic status] which impacts on student performance in government schools in NSW. That is, the SES of the other students in a school impacts on the performance of any other student, adding to the already significant impact of the student’s own SES on their performance… Irrespective of a student’s SES, their performance will, on average, improve if they attend higher SES schools.
The effect in low socioeconomic status schools is well known to teachers. The strugglers in these schools can look in vain around their classrooms to find some higher-achieving role models. As the example of Wagga Wagga shows, the ones who can afford it go somewhere else.
The capacity of parents to seek out and enrol their children in higher socioeconomic status government schools is determined by their location, mobility, and access to information and networks. Access to non-government schools is additionally determined by family income, combined with the extent to which students might meet a number of criteria. The consequence is that, to use the words of the funding review panel again, “differences in educational outcomes” are very considerably “the result of differences in wealth, income, power or possessions.”
Principals and some school authorities, especially in locally controlled schools, are intuitively aware of the benefits that accrue to a school if it is able to increase its enrolment of engaged students from aspirant families. They haven’t needed to be told of the powerful impact that selectivity in enrolment policy has on schools, to the advantage of some and disadvantage of others – although the latter is rarely considered. Enrolment selectivity, whether implemented in active or passive ways, is widespread in Australia, foremost in non-government schools but also in the increasing number of government schools that have the capacity to discriminate.
Looking for a way out: the Review of Funding for Schooling
Educators must be careful not to excessively ascribe the success or otherwise of schools to external factors (like socioeconomic status) and diminish the contribution of excellent teaching and school leadership on educational outcomes. But education policy and reform in Australia has tended to focus on the latter while ignoring the former. The review of funding provides a chance to achieve a better balance.
The compounding of underachievement in low socioeconomic status schools, created by the pooling of disadvantaged students, has all the hallmarks of a “wicked problem” – one that almost mocks attempts at resolution. An obvious solution is to create a far more balanced enrolment profile in all our schools, so that every student has the opportunity to learn with higher-achieving peers. But even in the most favourable political and public opinion circumstances this would be hard to sell to families who seek an advantage for their children in higher socioeconomic status schools.
A new funding model must include the following:
• Low socioeconomic status schools must be strongly supported to make them attractive to all families. They must cater for all and create a culture of quality and high expectations.
• The lowest-performing students must have, as a priority, the best possible teachers. But this is not about “waiting for Superman” – the teachers have to be supported in ways that improve their odds, and their students’ odds, of success.
• We can improve these odds if we deliver proven, innovative structures and programs. More of the same, however enticing, won’t work in production-line school contexts. Innovative structures, such as Big Picture education, must be systemically supported.
• We can and should still improve the mix of students in each school/class and anticipate that a needs-based funding model can still achieve this in some measure.
• We should explore ways to give low achievers greater access to their higher-achieving peers, through measures such as online sharing, joint activities, more mentoring within and between schools, and online gifted and talented programs.
There is no shortage of solutions that don’t work. We have seen many of these implemented and others are in the pipeline. Australian government policy, for example, is to increase the autonomy of government schools so that their operation – including control over some resource inputs – is closer to the model of non-government schools. Leaving aside PISA’s finding that this resource autonomy is not associated with high system performance, this option carries all the possibility of creating even more social differentiation within public education – another trend which PISA finds is not associated with high system performance. Stephen Lamb’s 2007 study of Melbourne’s schools provides a glimpse of the future if we venture further down this pathway.
Rather than dismantle those features of public education that guarantee reasonable equity, the current funding review should look towards a second option: requiring non-government schools to accept a wider range of obligations and operate in ways that ensure much greater equity of outcomes.
THE intention of governments has long been to support equity of outcomes – but the evolving framework of Australia’s schools has undermined this intention. We need to reaffirm our commitment to equity of outcomes by revisiting the purpose of school education and the unique role of inclusive schools in achieving this equity.
The capacity of the Review of Funding for Schooling to make a breakthrough is enhanced by its determination to consider all sources of income available to schools – and by its commitment to equity of outcomes. There is now substantial evidence of inequity in education outcomes and evidence that the social and academic divides between schools are increasing. In the absence of fundamental reform these divides will remain an obstacle as governments try to improve the opportunities for our most disadvantaged students, schools and communities. In particular we need to accept that students themselves are a most significant resource, yet are distributed in ways that compound both advantage and underachievement.
In searching for solutions we must provide our strongest support for low socioeconomic status students and schools by providing quality teachers, authentic school reform and organisation, an improved mix of students, and new learning opportunities. We can’t be sidetracked by forcing public schools, the ones that must cater for all students in all localities, into models of autonomy that don’t deliver and that may worsen equity of outcomes. We need instead to fund and support all schools in ways that will better balance their delivery of private advantage with a commitment to public obligation.