
I HAVE A GREAT IDEA to improve the health of Australians, and it goes to the heart of the problem: the performance of doctors. The profession has been operating free of scrutiny for too long and must be made much more transparent. As consumers we need to be assured that our local medico is up to standard.
How can we gain such an assurance? Easy: governments should measure and publicise, preferably on a website, the performance of doctors. What is their diagnosis strike rate? How many times do patients keep coming back with the same complaint? Doctors would get marks for having healthy patients, and lose marks when patients don’t get much better. If the mortality trendline leaps up off the chart then the surgery should be listed as a failed practice and everyone struck off. Higher scoring doctors, on the other hand, should be paid more.
Sure, there might be some downsides. The tabloid media would trawl the data to construct and publish surgery league tables. Low scoring doctors would be dragged through the toxic swamp of talkback radio. Doctors would try to explain the complexity of health issues but no one would listen. A shame, but our right to know and choose must come first.
Practices in suburbs with chronic health problems would go to the wall as patients flee to higher ranking medicos. The newest doctors would serve the poor while others would insist that patients pass a health test or pay inflated upfront fees before they get in the door. After all, this would be a free market at work.
When it inevitably goes pear-shaped, health ministers would spin and recycle time-honoured slogans about choice, transparency, quality and competition. If that doesn’t work they’d accuse the doctors, especially the bulk billers consigned to the poor, of having something to hide.
THIS IS A FANCIFUL prospect for doctors, of course, but not for schools as they grapple with the inevitable and well-documented impact of league tables. The move towards transparency for schools, ultimately represented by comparative tables, is a story of superficial and populist politics triumphing over caution. Supporters of league tables have an easy case to mount and sustain, couched as it is in the language of openness, transparency, choice and democracy. The education community will plead a case about research, evidence and equity, but the outcome is almost assured. As the American educationalist Gene Glass writes, “Where education is concerned, the old adage holds true: facts are negotiable; beliefs are rock solid.”
It’s possible that the fight isn’t over. The education interest groups have created a surprisingly broad front on the issue of league tables. The Australian Education Union, probably the best-organised group, has been joined willingly by subject associations and principals’ groups representing all education sectors. A capacity meeting in Sydney at the end of August saw Catholics and sinners, Greens and Nationals rubbing shoulders, with even Fred Nile offering the odd sentiment in support. While no shrinking violet, Julia Gillard seems to be talking less about the right of parents to choose and more about the need for information about schools so that she can plug the equity gaps.
But it is more likely that the current saga is playing out to an inevitable conclusion: there will be league tables, they will be constructed and presented in spurious and even fraudulent ways, they will accelerate the flight of parents towards middle class (“high performing”) schools and they will worsen prospects for our most disadvantaged children, schools and communities. The whole process will sit nicely alongside other “reforms” to mock official rhetoric about equity. And it is all proceeding despite the existence of better and more credible ways to increase the flow of accurate information to parents about schools.
The education ministers know all this but the rhetoric surrounding transparency is too attractive to ignore. Revealing such information, according to Julia Gillard, throws sunlight on what schools are doing. Nice line, but wrong source of light: league tables are a spotlight, not sunlight – they throw a bright, harsh and narrow band of light onto one aspect of schooling, leaving everything around it in darkness. Tests such as NAPLAN, the National Assessment Program–Literacy and Numeracy, are very useful tools to help analyse and improve student learning, but not much more. They were never intended to say anything useful about the performance of schools.
One of the more farcical elements of this unfolding drama is the image of all the education ministers furiously washing their hands as they announce that they don’t support “simplistic league tables” while watching the tabloid media do their very best to create exactly that. Indeed, the only state with legislative protection against such tables is reversing that policy faster than the average onlooker can say “cash from Canberra.”
THE EVIDENCE that some sections of the media have created misleading stories out of school NAPLAN test data is now out there for all to see. Unsurprisingly, it is the News Limited tabloids that are engaged in a race to the bottom in standards of reporting school test results.
The Hobart Mercury was first off the blocks. It crunched student literacy and numeracy results to come up with a total score for each school: words plus sums, divided by two, equals the worth of a school. Not content with leaving even the half-smart reader to work out what it all means, it then compared student attendance rates and achievement levels, coming to the stunning conclusion that you have to attend school to get the results. It also highlighted best and worst schools but basically concluded that other differences between the schools were probably too complex for readers to digest.
For Queenslanders the Courier-Mail first reported on the 2007 NAPLAN results in May this year. It revealed that small regional state schools were the star performers, something which is hardly surprising: most are too far away from other schools to have their enrolment depleted by what we call competition. The Courier-Mail’s more recent publication of the 2008 NAPLAN test results is worth a closer look. The paper published these results alphabetically by school, and buried deep in its report is this comment from the journalists Tanya Chilcott and Jane Chudleigh: “The Courier-Mail has chosen not to publish the information in league tables… in recognition that school resources and the socioeconomic status of students can affect results”
This encouraging depth of understanding didn’t extend to the headline: “Private schools top the class.” Nor did any qualifications temper the language of the main article. Complexities such as the resourcing and enrolment profile of schools were neatly flicked to one side; outstanding and poor test scores alike were simply attributed to schools and types of schools or to good teaching.
The report variously mentioned that schools “performed particularly well” or “made the top 100” or “did much better than” others. In the language of a sporting competition, readers were told that “State high schools were trounced by their private school counterparts” and that “Queensland came an embarrassing second last” compared to other states.
While the journalists involved might understand that the publication of NAPLAN results invites unfair comparisons, the stories in both newspapers illustrate a disconnect between any such understanding and what the newspapers are happy to print.
WHAT does NAPLAN really show for Queensland? Even a cursory scrutiny of the data shows that honest reporting would have stayed with the complexities and ditched the headlines and lead story. Like all student achievement data NAPLAN doesn’t say much at all about the worth of schools.
The most obvious complexity the Courier-Mail largely chose to ignore is the relationship between the results attributed to a school and the socioeconomic status, or SES, of the surrounding area. This can be mapped by using a sample of the first fifty state primary schools with more than 100 students listed in the paper’s “How your school performs” supplement.
In the graph below the average score of each school’s Year 5 cohort in reading, on the vertical axis, is compared to the average family income of people in the school’s local area (drawn from ABS data) on the horizontal axis. The graph shows that the reading results linked to particular schools rise with the income level of each school’s drawing area. As is always the case, there are schools outside the line of best fit, but the relationship shown is clear. There is nothing at all surprising in this graph, but it probably wouldn’t sell newspapers.
CHART 1 | QUEENSLAND NAPLAN: YEAR 5 – READING

First fifty government primary schools alphabetically
The Courier-Mail report leaned heavily on the alleged differences between private and public schools and included stories and comments which purport to explain such differences. Yet research consistently shows that the differences between the academic profile of public and private schools are overwhelmingly created by who walks in through the school gate each day.
Schools now have an extremely variable capacity to choose who does and does not enrol. The issues revolving around school choice, school obligations, operating procedures and various mechanisms to engineer enrolment are well known to most observers, but didn’t form any part of the Courier-Mail’s story.
We can even see how the relationship between academic achievement and enrolment profile creates a hierarchy among private schools. By looking at the first fifty non-government secondary schools listed in the “How your school performs” supplement we can see the relationship between Year 9 reading results and the SES of the students enrolled. In the graph below the vertical axis again shows Year 9 reading and the horizontal axis shows each school’s SES funding score. (Private schools usually don’t have distinct drawing areas so it isn’t possible to graph the relationship between “school achievement” and family income of the local area. But the SES index, used by the federal education department to calculate funding, is constructed from census collection district SES data for the students enrolled at each school.)
CHART 2 | QUEENSLAND NAPLAN: YEAR 9 – READING
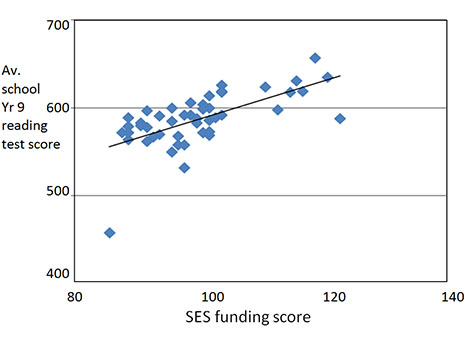
First fifty non-government secondary schools alphabetically
WHAT IS NEW in all this? Not much at all. School NAPLAN results simply show what any other comparison of raw test scores shows: that our schools are increasingly enrolling quite different populations – so different that comparing like with like is not possible in any fair and valid way. It is these different enrolment profiles that create most of the variations among schools. In the words of the head of the Australian Curriculum, Assessment and Reporting Authority, Barry McGaw, “little of the difference among schools in the educational performance of their students is a consequence of what the schools do; 70 per cent of it is due to whom they enrol.”
There is ample evidence to show this. In New South Wales the top of the HSC ladder is dominated by the (ever increasing) academically selective schools, both public and private, followed by (in approximate order) high-fee private schools, a mix of public schools in middle class areas and lower fee private schools, dominant regional schools, some more distant rural schools, and the rest. When I recently compiled two ranked lists of NSW private schools, by share of high achievers in the HSC and also by school SES score, thirty-three of the “top” fifty schools were common to both lists.
In Victoria, if VCE results are any guide, the highest scoring state schools belong to two main groups. The first includes many middle class schools in inner or eastern Melbourne. These are the schools that Melbourne University’s Stephen Lamb shows were best able to capitalise on state government devolution policies, and especially dezoning. The second group includes schools located in quite distant rural areas. In 2008 there were twenty government schools in the first 100; half of these were rural schools. In a previous article for Inside Story I explored some reasons for the phenomenon of apparent high achievement in many rural schools.
Anyone who believes that such rankings are about good and bad schools should again consider the hierarchy of private schools. The VCE ranking of private schools substantially reflects the level of fees charged and the socioeconomic funding index of the schools. The first fifty ranked private schools in 2005 charged upper end (Year 12) day fees averaging just over $17,000 (in 2008–09 dollars). Fees for the second fifty averaged $9500. Fees in schools below this top 100 averaged $5500.
The strong and enduring link between social class and student/school achievement should never be used as an excuse for schools. Every teacher and every school can make a difference for their enrolled students. But it remains true to say that the academic hierarchies between and among public and private schools have more to do with sifting and sorting enrolments than anything else.
THERE IS ALSO strong evidence to suggest that these hierarchies are becoming ever more entrenched, with combinations of deliberate policy and neglect helping to increase the gaps between schools. The moves to greater “transparency” and especially the creation of league tables will simply accelerate shifts in the enrolment profile of schools, increasing the divides.
The evidence is getting harder to avoid. The education consultant Barbara Preston has shown the changing ratio between low and high income families in schools. In 1996 there was an average of thirteen low-income for every ten high-income students in public school playgrounds. Now there are sixteen for every ten. The opposite trend occurred in private schools.
I have looked at the increasing academic divide in rural New South Wales using current and previous HSC results to map the changing academic profile of schools (bearing in mind that end-of-school student achievement data is a crude measure – especially as many young people don’t even get to the end of school, which means that HSC scores almost certainly understate the differences between schools). Enrolment figures show there were three main groups of secondary schools in the larger regional NSW centres in 2007: private schools, larger public high schools and smaller public high schools. In 2007 there were twelve larger public secondary schools in these towns; thirteen schools were noticeably smaller.
Obviously a range of factors affect school size and growth or decline, including the size of the area from which students are drawn and local demographic shifts, as well as genuine differences in quality and school leadership. But two things happened between 2000 and 2007: enrolment in the larger public secondary schools stayed constant while enrolment in the smaller schools fell by almost 20 per cent; and the number of private schools with HSC candidates increased (with a corresponding small decline in the average size of each school).
The share of high-end HSC results among these schools also changed. As a group, the private schools increased their share of high achievers by around 42 per cent, and the dozen larger public high schools increased their share of high achievers by 30 per cent. By contrast, nearby smaller high schools not only lost students but their share of high achievers almost halved. There was a clear quantitative and qualitative shift of students away from specific public schools.
FOR A RANGE of reasons it tends to be the more aspirational and able – and mainly middle class – students who shift schools. Various studies point to this qualitative and quantitative shift. In his Melbourne study Stephen Lamb shows that the students who travelled to attend schools away from their local area had a higher academic ability.
In the NSW example above, the schools that lost enrolments tended to be those with lower average family incomes and more Indigenous enrolments. One would like to believe that the movement of students reflected considered family decisions about teaching quality, but one of the common threads running through research into school choice is parents’ fear of the consequences for their children if they have to enrol with less able, at risk or sometimes just different fellow students in the local government school.
The schools that the middle class leave behind have a higher concentration of the most disadvantaged students, with an obvious impact on the academic profile of the school – and their position on any league table. Apart from the shameful impact on our most disadvantaged students this trend has significant implications for communities and social cohesion. It also makes harder the job of lifting the achievement of low-achieving students. Increasingly there is no one at school who can show the strugglers how it is done.
Those opposed to the publication of league tables believe that the greater availability of what amounts to social rankings of schools will worsen this situation. The extent to which this happens partly relates to the affordability of private schools. A review of private school funding might well lead to a redistribution of resources (federal government protestations notwithstanding) from high-fee to low-fee private schools. Even if they get only some of the $2.6 billion windfall they will be able to reach into yet another layer of the middle class.
The impact of league table rankings will also depend on how far the current moves to make public schools more autonomous proceed. Stephen Lamb’s study clearly shows that giving local schools greater discretion over enrolments accelerates the shift of students into schools in higher SES areas. Moves in Western Australia to create a class of “independent” public schools will certainly achieve the same result. Even in relatively centralised systems there aren’t too many rules capable of standing between a school principal and a “desirable” student enrolment.
The signs are that the school divide is about to get much worse. •