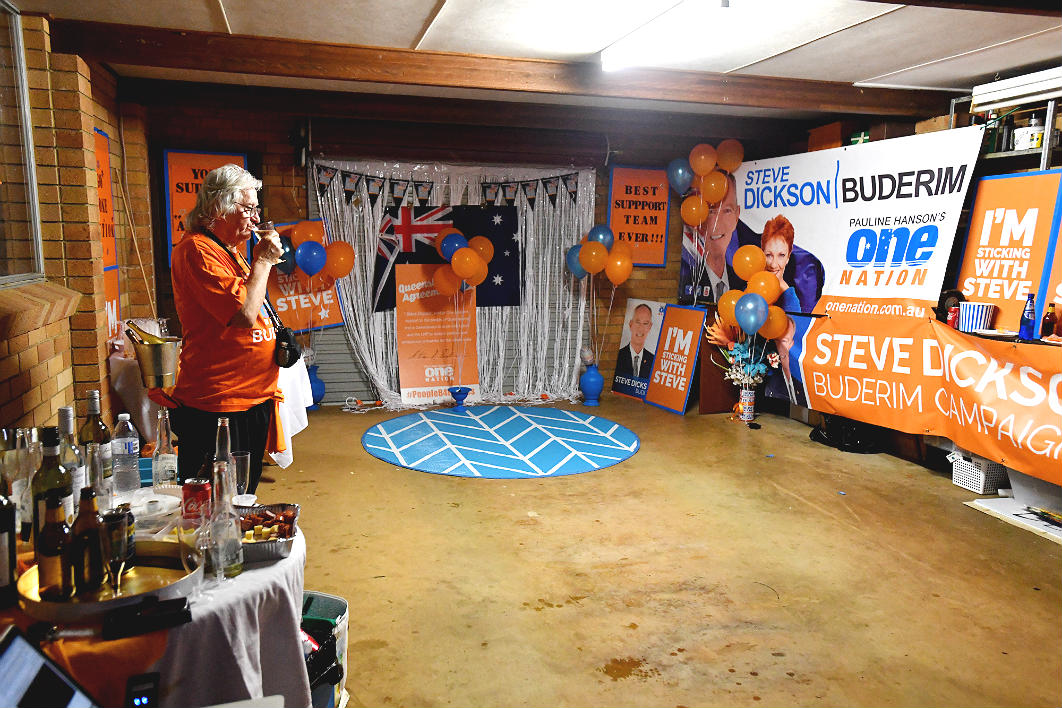
One Nation voters in Queensland gave most of their preferences to the Liberal National Party in thirty-seven of the thirty-eight seats where the result came down to a shootout between the LNP and Labor, final election results show.
Preference counts by the Electoral Commission of Queensland decisively torpedo the theory repeatedly advanced by the Australian — without any evidence — that One Nation’s decision to preference against sitting members in most seats cost the LNP the election.
The actual counts show that One Nation voters took little notice of their party’s how-to-vote card, if they ever saw it. But unlike last year’s federal election, when Pauline Hanson’s supporters split their preferences almost evenly between the two major parties, this election saw them consistently prefer the Coalition.
In the small number of seats where One Nation officially directed preferences to Labor, the election results show 58 per cent of its voters ignored the ticket, and instead gave their preferences to the LNP. Only 42 per cent went to Labor.
In the seats where the party directed preferences to the LNP, 68.5 per cent did so, while the other 31.5 per cent, almost one in three, preferenced Labor.
A 180-degree difference in voting directions made only a small difference to what voters did. The numbers imply that only one in ten One Nation voters followed the party ticket, with the other 90 per cent doing as they pleased.
Why? Queensland is a big state, and One Nation is a relatively small party; with 1669 polling booths to cover, many, maybe most, of its voters probably never saw its how-to-vote card. But even if they did, these voters are rebels against authority. They would not follow their party’s directions ahead of their own wishes — and they weren’t alone in that.
Every party saw large-scale defections from its how-to-vote cards. LNP voters are much more inclined to stay in line, but in the seats of Logan and Thuringowa, where party HQ directed them to preference Labor ahead of One Nation (because its candidates were seen as unsavoury), half of them preferenced One Nation anyway. In the seats where the LNP preferenced One Nation, almost 30 per cent of its voters rebelled. Labor preferenced the LNP over One Nation in every seat, but 35 per cent of its voters broke ranks to make Pauline Hanson’s party their second choice.
Mostly, One Nation voters backed the conservative side. In all, their preferences were distributed in forty seats, and most of those preferences ended up with the LNP in thirty-seven of them. The three exceptions were in Hinchinbrook, where they favoured Katter’s Australian Party; Noosa, where they went to independent Sandy Bolton; and Redlands, where 50.9 per cent went to Labor and 49.1 per cent to the LNP.
(Even that might understate the pro-LNP tendency. By the time One Nation preferences were distributed in Redlands, many came from voters whose first preference had gone to former LNP member Peter Dowling — the MP who lost preselection in 2014 after sending a woman a photo of his penis in a wine glass. Most of his supporters never accepted his dismissal by party HQ; it would be no surprise if they put his replacement last. It’s possible that most of One Nation’s own voters in Redlands put the LNP ahead of Labor.)
What is remarkable is that, despite a record 31 per cent of Queensland voting for minor parties and independents — 13.7 per cent for One Nation and 2.3 per cent for its electoral ally, Katter’s Australian Party, 10 per cent for the Greens, and almost 5 per cent for the rest — their preferences had very little impact on the outcome.
In all, the figures show that eighty-four of the ninety-three seats were won by the party that topped the poll on primary votes. Preferences changed the outcome in just nine seats:
● The LNP lost four (Aspley, Gaven, McConnel and Mansfield) to Labor on Green preferences, and one (Maiwar) to the Greens on Labor preferences.
● Labor lost two (Burdekin and Pumicestone) to the LNP on One Nation preferences, and one (Mirani) to One Nation on LNP preferences.
● The LNP lost Hinchinbrook to Katter’s Australian Party on preferences from Labor and One Nation alike.
In a first-past-the-post system, the LNP would have won three more seats, but Labor would still have won government, with a majority of one, and three friendly crossbenchers. This was an election in which preferences largely cancelled each other out.
One Nation came third behind the major parties in thirty-three seats and, overall, its voters gave 65 per cent of their preferences to the LNP. The Greens came third in twenty-seven seats, and its voters gave 76 per cent of their preferences to Labor.
In the three Brisbane seats the Australian claimed One Nation preferences “handed to Labor,” the results reveal that, in fact, 53.3 per cent of One Nation preferences went to the Coalition, 30.3 per cent to Labor and 16.3 per cent to the Greens. As 25 per cent of Green preferences then went to the LNP, it’s safe to say that the LNP ended up with at least 57.5 per cent of One Nation preferences in the three seats, and probably more.
Even in the north Queensland seat of Burdekin, where One Nation was officially directing preferences to Labor, 62 per cent of its voters preferenced the sitting LNP member Dale Last, allowing him to come from 1600 votes behind Labor to snatch a narrow win.
The really decisive figures in this election were the first-preference votes. Labor won 35.4 per cent of the votes, the LNP 33.7 per cent. More than anything else, that explains how Labor won the election. ●


