With the Senate threatening to block a majority of the government’s proposed savings measures, the 2014 federal budget is undoubtedly the most controversial for many years. Even though the fiscal contraction expected from this year’s budget is about two-thirds that of the Howard government’s first budget in 1996, the reaction of voters has been very different.
An Essential Vision poll found that 61 per cent of respondents felt the budget would hurt the most vulnerable people in Australia, with qualitative research by IPSOS finding that voters’ hostility to the budget is largely driven by concerns it will promote a less equal and less caring society. Rather than directing their anger at measures that hit their own hip pockets, many of those surveyed repeatedly express concern about the impact on others, especially their children and the poor. According to the Conversation’s Michelle Grattan, the much-criticised budget is feeding into a wider debate about inequality in Australia.
Measuring the budget’s impacts
In the days following the budget two quantitative analyses attempted to identify the winners and losers. The first of these, which I undertook with Daniel Nethery, a colleague at the Crawford School of Public Policy at the Australian National University, was a fairly simple analysis of the impact of selected budget changes. Using an approach usually described as the “cameo” or “hypothetical family” method, we calculated how the changes would affect the disposable incomes of a small range of family types.
A similar calculation has appeared each year since 2005 in an appendix to the Budget Overview showing what different types of households gain from policy changes announced in the budget or over the course of the current government. This year, the table was absent from the budget papers, probably because showing losses in disposable income is not as politically attractive as showing increases, which previous papers have typically done.
Using the projections set out in the budget, we essentially replicated the methodology used in earlier budget papers to compare the impact on disposable incomes in 2016–17, the year in which all of the measures we assessed would have come into effect. We found that working-age people on social security payments will be affected most by the budget. An unemployed twenty-three-year-old will lose $47 per week or 18 per cent. An unemployed lone parent with one eight-year-old child loses $54 per week or 12 per cent. Lone parents earning around two-thirds of the average wage lose between 5.6 and 7 per cent. A single-income couple with two school-age children and average earnings loses $82 per week or 6 per cent. By comparison, an individual on three times the average wage – close to $250,000 by 2016–17 – would lose just $24 per week, or less than 1 per cent of disposable income, through the deficit levy.
These calculations were conservative. They did not take account of the proposed abolition of the Schoolkids Bonus, which was not a new budget initiative; nor did they include the increased cost of healthcare and fuel or the changes to higher education.
The most comprehensive analysis of the distributional effects of the budget was undertaken by the National Centre for Social and Economic Modelling, or NATSEM, at the University of Canberra. Using Australian Bureau of Statistics data on the distribution of household incomes, NATSEM divided the community into five segments or “quintiles,” each made up of a little over 2.5 million households. It found that the poorest 20 per cent – those with $35,000 or less in disposable annual income – would forgo $2.9 billion over four years thanks to changes to family benefits, pensions and other payments. More than one-third of the budget cuts, or $6 billion worth, would fall on the middle quintile of households, those earning between $45,000 and $63,000. The wealthiest 20 per cent of households, meanwhile – those earning $88,000 or more after tax and benefits – would lose $1.78 billion, some 40 per cent less than the lowest-income families.
Given that the most recent figures from the Australian Bureau of Statistics, or ABS, show that the poorest 20 per cent of households receive about 7.5 per cent of disposable income while the richest 20 per cent receive 39.5 per cent, it is clear that the impact of the budget in relative terms is much greater on low-income households than it is on high-income households. The poorest 20 per cent of households, which receive less than 8 per cent of total income, are the source of at least 16 per cent of the expenditure savings.
The impact on different income groups can also be gauged by considering which sectors the budget savings are coming from. In a speech to the Sydney Institute after the budget, Joe Hockey emphasised the fact the government will spend $146 billion – “35 per cent of the federal budget” – on welfare in 2014–15. That might be true, but this sector provides a larger share of the proposed cuts. Budget Paper No. 2 shows that out of total projected expenditure cuts of $29.4 billion between 2014–15 and 2017–18, $15.4 billion, or 52 per cent, comes from programs of the Department of Social Services. (This compares with revenue measures estimated to raise an extra $8.7 billion over the period, not including fiscal drag.)
Even more striking is the budget’s impact on spending on the unemployed. Support for the unemployed costs around $10 billion annually, or less than 2.5 per cent of the budget. Of people receiving the two benefits – Newstart and Youth Allowance (Other) – around 37 per cent are under the age of thirty; given that Youth Allowance recipients are paid less than Newstart recipients, we can conservatively estimate that payments for this group account for around 0.9 per cent of the budget. From next year, unemployed people under twenty-five will get Youth Allowance rather than Newstart, and people under thirty will wait up to six months before getting unemployment benefits, and will then have to participate in Work for the Dole to be eligible for income support. The projected savings from these changes amount to about $2.8 billion over the period 2014–15 to 2017–18, or about 9.5 per cent of the total budget spending cuts. In other words, unemployed people under thirty receive less than 1 per cent of total budget spending but are the source of close to 10 per cent of total expenditure savings.
Are criticisms of the budget “class warfare”?
In a subsequent speech to the Sydney Institute, the treasurer defended the budget against claims of unfairness, arguing that the criticisms have been political in nature and have “drifted to 1970s class warfare lines, claiming the budget is ‘unfair’ or that the ‘rich don’t contribute enough.’” He described this criticism as a “misguided cry” and outlined a range of contrary arguments for the fairness of the budget strategy.
His first argument in defence of the fairness of the budget arose from twenty years or more of “uninterrupted economic growth”:
The average Australian household is almost $290 per week better off today in real terms than they were around two decades ago. And this growth has been broadly based across society. Household wellbeing across the community has grown significantly in the last two decades. And while much focus has been on the “rich getting richer,” the more accurate story is the fact that everyone is getting richer as a result of economic development.
Superficially, this story has some force. As Chart 1 below shows, real disposable incomes have grown very significantly across the income distribution since 1994–95. The two groups enjoying the largest real increases are those at the fortieth percentile (the group whose incomes exceed those of the bottom 40 per cent of the population) and those at the ninetieth percentile. While the poorest 40 per cent have also enjoyed significant growth, this is lower than for any other group. Those above the ninetieth percentile – the richest 10 per cent – have experienced the highest real income growth in the OECD.
Chart 1: Change in real equivalent household disposable income, Australia, 1994–95 to 2011–12
Source: Calculated from ABS, Household Income and Income Distribution, Australia, 2011-12, Catalogue No. 6523.0.
But the conclusion that everyone is better off now than two decades ago glosses over the complexities of analysing income trends. The rising tide of prosperity hasn’t lifted all boats because people at different income levels in 2011–12 are not the same people at each level in previous years.
Because allowances for the unemployed and the sick have been indexed to prices rather than community-wide incomes, the people in these groups, for instance, have been slipping down the income ladder for the last two decades. In the mid 1990s a single person receiving Newstart would have been about $10 per week (in current terms) below the tenth percentile of the income distribution, but by 2011–12 he or she would have been close to $160 below that percentile. Unemployed people on youth allowance would be even lower – if somehow they could afford to live by themselves.
Another group that hasn’t enjoyed the general rise in prosperity is made up of lone parents whose youngest child is aged eight years or more, who now receive Newstart rather than the more generous parenting payment. Their real incomes have already been cut, first by the Howard government and then by the Gillard government, by around $160 per fortnight. The proposed change to family tax benefit part B would reduce their benefit incomes by a further $100 per fortnight.
It is striking that the young unemployed and this group of lone parents would have their incomes cut by a further 12 to 18 per cent under the budget proposals. Those who have not benefited from Australia’s growing prosperity are those most adversely affected by the budget.
Is the Australian social security system poorly targeted? Are poor Australians overly reliant on welfare?
In defending the proposed budget cuts, Joe Hockey also argued that “our welfare system is unsustainable in its current form” and “is not well targeted to those who really need our assistance.” He went on:
Payments are too broadly available to too many people. As a result, less is available for those most in need. At the moment over half of Australian households receive a taxpayer-funded payment from the government.
This is a variation on the treasurer’s much–debated argument that the “Age of Entitlement” is over, a theme he first articulated in 2012.
The treasurer also noted, however, that “according to the OECD Household Income Survey, Australians in the lowest 20 per cent of income had the highest reliance on government for income of any country in the world.” Low-income Australians have less private income and more government benefits, he said, than similar groups in Germany, France, the Netherlands, Finland, Norway or many other countries where government is much larger and the private sector is smaller as a percentage of the economy. On this basis, he concluded that “this OECD survey illustrates that our income redistribution from taxpayers to tax receivers is more comprehensive and broader than any other country in the world.”
Table 5 of that OECD report shows that social security payments accounted for around 72 per cent of household disposable income for the poorest income group in Australia, but this share was higher in Denmark (87 per cent), Finland (78 per cent) and Sweden (84 per cent). This is illustrated in Chart 2.
Chart 2: Social security benefits as percentage of disposable income of poorest 20 per cent of households, 2009–10
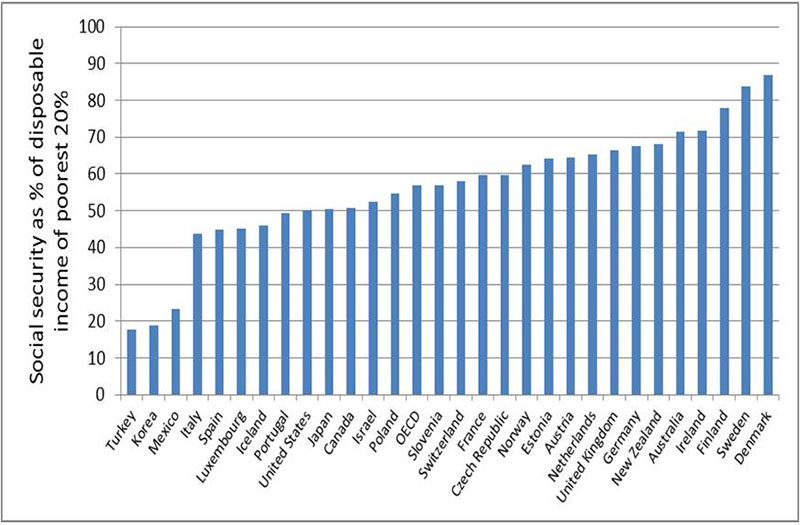
Source: Calculated from Table 5, OECD, 2014
Interpreting these figures is not straightforward. One of the reasons why Australians on the lowest incomes rely strongly on social security payments is that Australian age pensioners are much more likely to be in the lowest income group than are pensioners in other countries, as other OECD studies show. Social security is a more important source of income than work because many of them are retired.
Another way of expressing this is to say that if the lowest income group in Australia is more reliant on welfare, this means that more of the poor in other countries are working – and that means those countries have more working poor, which presumably is not a desirable outcome.
But the main reason why social security is more important for low-income groups in Australia is that we have the most targeted social security system in the OECD, as shown in Chart 3. The lowest-income Australians rely mainly on social security because we apply income tests to payments more than any other country. Rather than being surprising, this simply reflects a system doing exactly what it is designed to do.
Chart 3: Ratio of transfers received by poorest 20 per cent to those received by richest 20 per cent, 2009–10
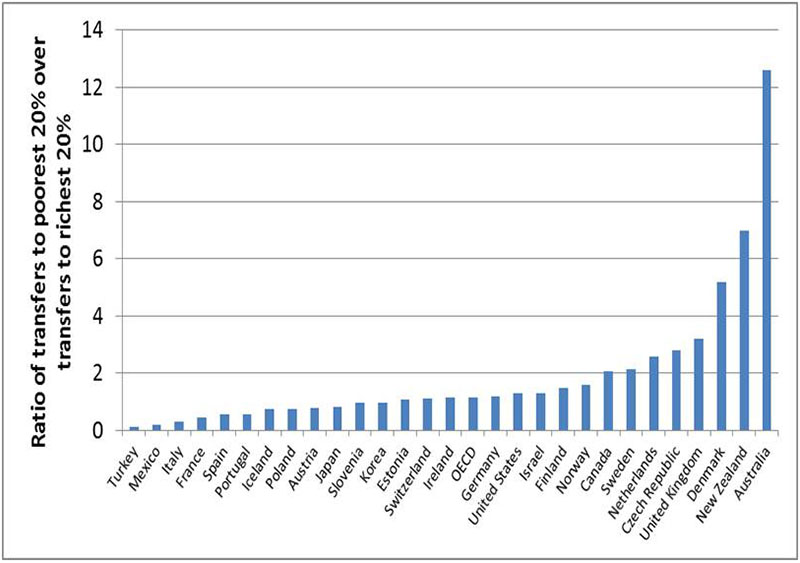
Source: Calculated from Tables 3 and 5, OECD, 2014
Table 5 of the OECD Report also shows that total social security payments in Australia, at 12 per cent of average household income, are the third-lowest in the OECD. For the OECD as a whole, the figure is around 22 per cent; for Denmark, Finland and Norway it is between 24 and 32 per cent. The only countries where social security payments are lower as a share of average household incomes are Korea and Mexico, where welfare provisions are much less developed – although Korea is rapidly moving up the OECD spending ladder.
For the richest income group in Australia, Chart 4 shows that social security benefits provide only 1 per cent of household disposable income – a share that has halved since the mid 1990s – and by far the lowest in the OECD. On average for OECD countries, social security provides 10 per cent of the income of the richest quintile, with the share being as much as 20 per cent in Austria and close to 30 per cent in Italy and France.
Chart 4: Social security benefits as percentage of household disposable income for richest 20 per cent, 2009–10
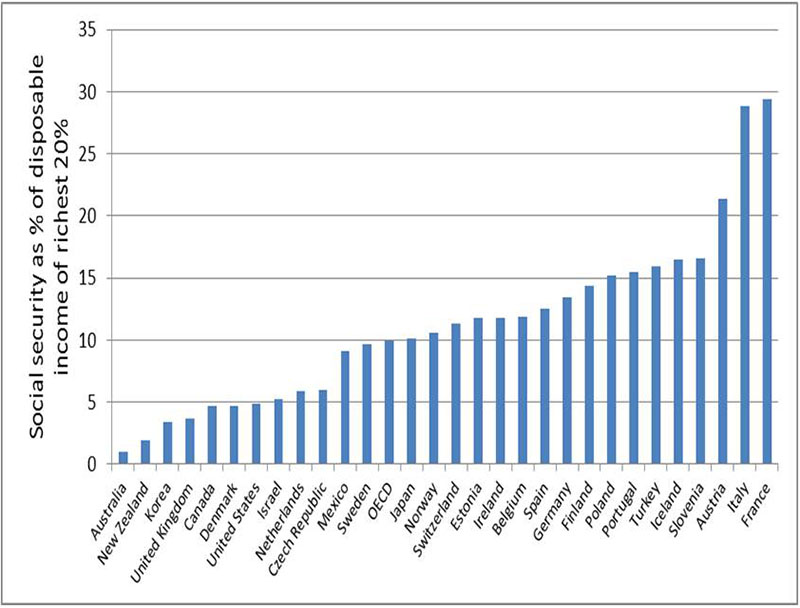
Source: Calculated from Table 5, OECD, 2014
Because Australia directs the highest share of its social security spending to the poor and the lowest proportion to the rich, another recent OECD study of the equity implications of fiscal consolidation concludes that across-the-board cuts in social security would increase inequality in Australia more than any other country. So it is difficult to understand why the treasurer argues that the system is not well-targeted, particularly when using OECD comparisons that show the opposite of the conclusions drawn in the speech (a point made by David Uren in the Australian).
Some of the budget proposals do involve greater targeting – for example, a lowering to $100,000 per year of the threshold for receipt of family tax benefit part B for families with children under six years of age. But other proposals involve reducing benefits for the poorest welfare recipients, a form of reverse targeting.
Is fairness in the eye of the beholder?
Griffith University economist Ross Guest has argued that government budgets are “a hotchpotch of ad hoc tweaks here and there with no rhyme or reason.” This needs fixing, he argues:
First, governments should set a target for the distribution of household income and wealth using a standard measure such as the Gini coefficient… Once we’ve set the fairness target, we need an independent organisation like NATSEM to do a pre-budget assessment for the government, against our fairness target, of proposed budgetary changes. Then at least we will be able to make an overall assessment of the fairness of the budget, in the same way as we assess the budget against a range of fiscal targets such as the budget deficit, growth of government spending and government debt.
From this perspective, the impact of federal budgets on the distribution of income is an important piece of information to be used in evaluating policy proposals. But Guest also points out that what constitutes a “fair” distribution of national income ultimately comes down to social value judgements.
Here we come to another of Joe Hockey’s arguments. “Whilst income tax is by far our largest form of revenue, just ten per cent of the population pays nearly two-thirds of all income tax,” he told the Sydney Institute. “In fact, just 2 per cent of taxpayers pay more than a quarter of all income tax. Maybe these taxpayers would argue that the tax system is already unfair.”
The Australian’s Adam Creighton had made a similar argument under the headline “No, the Rich Don’t Pay a ‘Fair Share’ of Tax. They Pay All of It.” According to ABS figures, he wrote, “only the top fifth of households ranked by their income – those with incomes of more than $200,000 a year in the financial year ending June 2012 – pay anything into the system net of the value of social security in cash and kind received.” In a similar vein, the Institute of Public Affairs has argued that “NATSEM’s figures might be right, but it’s quite wrong to, therefore, claim they prove the budget is inequitable. There’s a world of difference between the government giving you less of something that isn’t yours to begin with, and the government taking something from you that is yours in the first place.”
In his budget speech the treasurer expressed this argument in a different fashion: “We must always remember that when one person receives an entitlement from the government, it comes out of the pocket of another Australian.” In his speech to the Sydney Institute, he used the same “lifters and leaners” analogy as in the budget speech, asking whether it was fair that “the average working Australian, be they a cleaner, a plumber or a teacher, is working over one month full-time each year just to pay for the welfare of another Australian.”
In his Sydney Institute speech, the treasurer went on to say that “in striving to achieve equality, it is not the role of government to use the taxation and welfare system as a tool to ‘level the playing field.’” This statement is puzzling, since the main objective of a progressive tax system is indeed to “level the playing field.” Our social security system has long been the most progressive in the OECD, and targeting benefits to the poor is another way of levelling up. The real meaning of these statements appears to be that we have been unfair to the rich and the budget is a way of correcting this – though none of the budget’s defenders would put it so directly.
But while the richest do pay a higher share of taxes under a progressive tax system, the richest 10 per cent of Australians have actually enjoyed the largest increase in disposable incomes of any OECD country. Moreover, the rise in income inequality in Australia in the period up to the global financial crisis was largely due to a reduction in redistribution between rich and poor. Nicolas Herault and Francisco Azpitarte of the University of Melbourne have found that inequality of market incomes in Australia actually fell after 2000, but disposable incomes became more unequal because the redistributive impact of taxes and transfers also fell.
As the OECD has commented:
The tax-benefit system in Australia has offset just over half of the rise that occurred in market income inequality during the past two decades, a percentage that is higher than in many other OECD countries. Nonetheless, since the mid 1980s, taxes have become less redistributive. Both progressivity and average tax rates have declined. And since the mid 1990s the overall redistributive effect also weakened. In most cases, out-of-work income as a proportion of in-work income has fallen, in part due to allowance rates failing to keep pace with wage growth. The flattening of the personal income tax system in the mid 2000s (e.g. through increases to the top threshold) also contributed to a reduced capacity of redistribution.
Fundamentally, however, views about the fairness or otherwise of the budget reflect different values. As Fairfax journalist Jock Cheetham has pointed out, different concepts of fairness are being used by the different sides of this debate. On the one hand, he observes, fairness is being interpreted as equality; on the other hand, it is interpreted as proportionality – that “people should be rewarded in proportion to what they contribute, even if that guarantees unequal outcomes.”
In a similar vein, Jackie Brady from Catholic Social Services Australia argues that:
an assumption lurking behind these arguments is that a person’s market income is a reflection of their contribution to the community. The idea is that people who create the greatest value for others earn the highest incomes and those who contribute the least, should earn the least. Together with the claim that people are only morally entitled to what they can earn it suggests that family tax benefits and income support payments are actually a gift that productive people make to those unable or unwilling to pull their own weight. So far from complaining about budget cuts, low-income families should be grateful they get anything at all.
In a somewhat different context, US economist Brad DeLong argues against this “just deserts” theory of income distribution, referring to arguments by Amartya Sen that it is not only ambiguous but also “richer in powerful rhetoric than in substance.” According to DeLong:
our moral-philosophical discussion of who deserves what has gotten tangled up with the economics of the marginal productivity theory of distribution in a fundamentally unhelpful way… We would have a much clearer discussion of issues of inequality and distribution if we simply stuck to considerations of human well-being and useful incentives.
The opposing sides in this debate may not reach agreement on these different value positions, but it can be shown that some of the factual basis for the “lifters and leaners” dichotomy is not as robust as it appears.
The combination of a progressive direct tax system with a highly targeted income support system means that the tax-transfer system, as a whole, redistributes to low-income groups. Chart 5 shows estimates from an ABS study of the impact of government benefits and taxes on household income, which found that in 2009–10 the bottom 60 per cent of Australian households were, on average, net beneficiaries of the welfare state, with the top 40 per cent, on average, being net contributors.
Chart 5: Weekly benefits received and taxes paid, by quintiles of equivalised private income, 2009–10
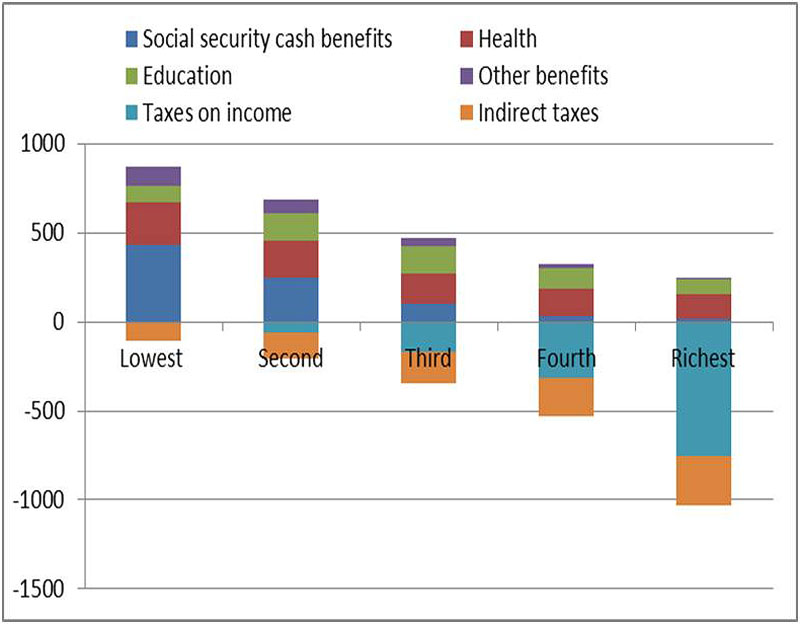
Source: Estimated from ABS, Government Benefits, Taxes and Household Income, Australia, 2009–10, Catalogue No. 6537.0
Unlike the figures cited by Adam Creighton and the treasurer, these figures take account of indirect taxes. Because they are averages for income groups, they mask a small number of zero net taxpayers in the highest income groups and larger numbers of positive taxpayers in lower income groups. These anomalies reflect the fact that the distinction between people who are net contributors and net recipients reflects not only income but also age and household circumstances.
As shown in Chart 6, households are net contributors, on average, when the household reference person is aged between twenty-five and thirty-four years or between forty-five and sixty-four years, and are net recipients when the household reference person is aged fifteen to twenty-four years (likely to be in tertiary education), when the household reference person is aged thirty-five to forty-four years (because dependent children are part of the household), or when the household reference person is sixty-five years or over.
Chart 6: Benefits received and taxes paid (2009–10, dollars per week) by age of household reference person, Australia, 2009–10
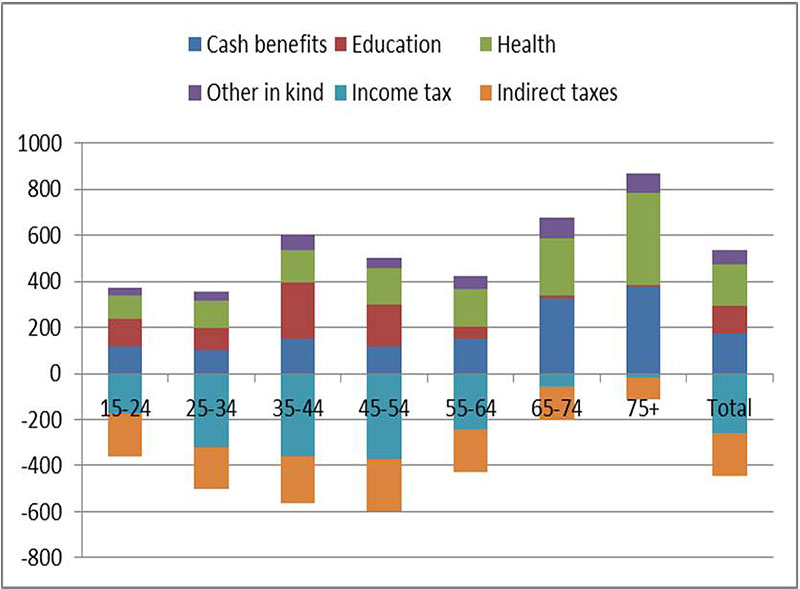
Source: Estimated from ABS, Government Benefits, Taxes and Household Income, Australia, 2009–10, Catalogue No. 6537.0
Households with a head aged sixty-five years or more receive by far the greatest net benefits. A high proportion of them receive at least part of the age pension; they are heavy users of the healthcare system; and they pay very low levels of direct tax. Their low tax payments reflect their low overall incomes, together with special tax offsets and the concessional tax treatment of superannuation.
It’s important to remember that most people aged over sixty-five were net taxpayers when they were of working age, so classifying them as “leaners” fails to take account of any contributions they made earlier in life. Similarly, many low-income families with children may currently receive more in family benefits and education than they pay in taxes, but they will pay more in taxes after their children have left home, and in future years their children will pay taxes too. As in most other rich countries, public spending is an important instrument for redistributing resources across the life course.
In addition, women are more likely than men to be receiving social security payments. Although they tend to live longer, their lower lifetime earnings mean they will have paid lower taxes during their working years and have fewer private resources in retirement. These circumstances are primarily a consequence of their greater role in caring for children and, later in life, for the frail elderly. On average, their net financial contributions may not be as great as men, but would it be reasonable to characterise them as “leaners”?
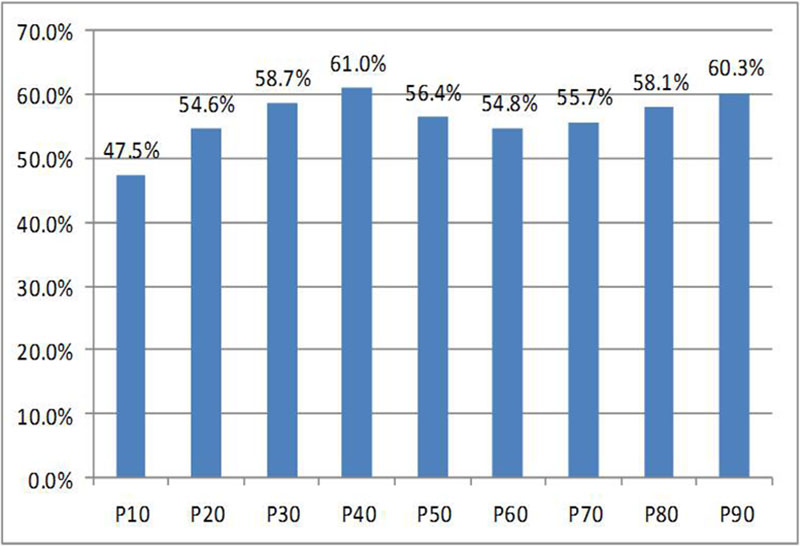
Even the distinction between low- and high-income earners is not hard and fast. The Household Income and Labour Dynamics in Australia study, or HILDA, shows that people both ascend and descend the income ladder. Between 2001 and 2010, only 2.2 per cent of the Australian population stayed at the same percentile of the income distribution; around 21 per cent went up more than two deciles (through two bands made up of 10 per cent of income earners, that is), close to 30 per cent went up by less than two deciles, 27 per cent went down by less than two deciles and 21 per cent went down by more than two deciles. People rise up the income distribution because they leave study and get jobs or because they are promoted at work or because they marry or because their children leave home, and they fall down the income distribution because they retire or become unemployed, become sick or disabled or separate from partners, or because they start to have children.
In fact, only around 47 per cent of those who were among the poorest 20 per cent of the population in 2001 were still there in 2010, with the same percentage of those in the richest 20 per cent in 2001 still there in 2010. Mobility is greater in middle income groups because there it is possible to experience both rises or falls in income, whereas if you start at the top you can only go down, and if you start at the bottom you can only go up. As a result, only a quarter of those in the middle 20 per cent of the population in 2001 were still in the same income group in 2010, with a third being in a lower income group and close to 40 per cent being in a higher income group.
Partly as a consequence, 65.7 per cent of working-age Australians lived in a household where someone received welfare at some time between 2001 and 2009. In any one year during that decade, between 5 and 7 per cent of working-age Australians received 90 per cent or more of their income from welfare payments (not including family payments); and at some stage in the period, fully 15 per cent of the population was in that position (although only 1.2 per cent were reliant for all nine years).
The position for young people is even more striking. The most recent HILDA report found that 80 per cent of people who were aged eighteen to twenty-four in 2001 received a welfare payment at some time between 2001 and 2011, but only 0.3 per cent of these people received 90 per cent of their income from welfare for all eleven years.
In other words, people of working age who are “welfare dependent” for long periods are only a tiny percentage of the population, while many highly or very highly paid individuals face substantial risks of large income drops, associated particularly with health changes but also with changes in employment and family status. The welfare state – defined broadly to include health and education as well as social security payments – touches the lives of many more Australians than is commonly thought. Nearly everyone may be a “lifter” or a “leaner” at different stages in their life.
Perhaps the very fact that a majority of working Australians have needed to use welfare payments, or know family members who have needed to use welfare, has contributed to the unpopularity of the budget. It is easier to put yourself into the shoes of the unemployed, the sick or people with disability if you or your family members have experienced the impact of these risks.
While the opposing sides may not reach agreement on these different value positions, the challenge the government faces is that a majority of Australians appear to have adopted a different value position from that which underlies the budget and is used by its defenders. •