
At long last, we are talking about the growing inequality that has marked Australia in the post-reform era. At last, we have a political party that is prepared to tackle at least part of the problem: the tax loopholes that allow so much income to avoid redistribution through the welfare safety net. And even the Coalition is taking some steps down that path.
But in some people’s minds, it seems, the debate about inequality has got tangled up with the rise of minor parties. The economic slump in the Midwest rustbelt clearly played a large part in Donald Trump’s victory in last year’s US election, just as factory closures, high unemployment and stalling incomes have fuelled the growth of the National Front in France (especially the north), the growth of Podemos in Spain and, to a lesser extent, success of the Brexit campaign in Britain. Is the same thing now happening here?
No, argues David Marr, in his recent Quarterly Essay, The White Queen: One Nation and the Politics of Race. Hanson’s support, he claims, is based on her appeal to racists, with a dash of nostalgia. No, implies the Grattan Institute, in a new working paper this week, which argues that regional Australia, where One Nation’s support is highest, has matched the city in income growth and unemployment rates over the last decade.
The Grattan report, say its director John Daley and co-authors Danielle Wood and Carmela Chivers, “is part of broader work at the Grattan Institute trying to understand why the vote for minor parties has risen rapidly over the past decade, particularly in regional electorates.”
They are concerned that the rising vote is “being used to justify all kinds of policy changes such as increased income redistribution, more spending on regional development, tighter migration controls, and more security regulation… based on assumptions about what is really driving voting patterns.” By asserting that the bush is doing okay, the paper is clearly arguing against “increased income redistribution” and against more spending in the bush.
Political analysis of this kind is outside Grattan’s normal area of operations. And this working paper is not an auspicious start. In particular, it seems to be totally unaware that regional Australia — or, at least, regional New South Wales and Victoria — has experienced a long drought in full-time employment, forcing many of its young to leave home to get a decent job.
Let’s look at what we know. It is clearly the case that ordinary Australians are struggling as income growth has slumped and household debt has soared to record levels. It is clearly the case that inequality in Australia has risen sharply over the past twenty years. And it is clearly the case that the vote for minor parties and their numbers in the Senate soared to record levels at last year’s election — and that One Nation’s support in recent Newspolls has soared since the election to an average of 10 per cent.
It would be simplistic to argue that the rise of One Nation and other minor parties is solely the result of declining real household incomes and growing inequality — and I’ve not seen anyone argue that it is. But without solid evidence, it is equally simplistic to argue that the rise of the minor parties has nothing to do with the growing economic pain in ordinary households.
As I pointed out after the election, the main reason for the rising minor-party vote in recent years is simply that there are far more minor parties contesting seats, even if most of them have no prospect of winning. And the main reason for the rise of One Nation this year has been the failure of the Turnbull government to provide decisive leadership, because the Coalition is too divided to allow it and Turnbull has lost the political strength to impose his will on the recalcitrants. By contrast, as voters remarked in the focus groups Fairfax reported this week, Pauline Hanson at least stands for something.
We’ll come back to the politics. My main concern is that we should not reach conclusions on the basis of skimpy statistics, cherrypicked to meet our prejudices. The way to understand statistics in any area is to take the data as a whole, and try to work out what it means.
I have great respect for the work of the Grattan Institute, especially on budget policy, where it has been a rock of integrity. I have great respect for David Marr’s journalism. But as I argued at the end of my previous article, Marr’s claim that economic hardship is not a factor in One Nation’s rise rests on an unrepresentative survey of, at best, seventy-two One Nation voters, too small and lopsided to form the basis of such a sweeping conclusion.
The Grattan Institute has at least gone to the Australian Tax Office and the Australian Bureau of Statistics for its implied conclusion that the bush is doing okay in economic terms. But its focus on the numbers is selective, and hence its conclusions — especially on employment — are misleading.
Grattan’s analysis finds that, based on the ATO’s data on taxable incomes, “income growth per person in most regional areas has kept pace with the average in their state over the past decade.” An accompanying graph implies that, in fact, it was the outer suburbs of the big cities that experienced the slowest income growth in the decade to 2014–15, while the inner suburbs experienced the fastest growth in per capita income.
With two caveats, that is probably true, though puzzling. The 2016 census figures imply the same conclusion. Yet it’s hard to explain. Sure, the mining regions saw big growth in incomes and, to a lesser extent, so did fast-growing inner regional cities such as Geelong, a few coastal regions, and the areas just beyond the city boundary now being settled by urban commuters. But all that still leaves out most of regional Australia. By and large, those who have done best in the past decade are the managers, professionals and investors, and there aren’t many of them in the bush. Researchers will need to look at these figures in more detail to work out what actually happened.
Now, the two caveats. First, the ATO provides two sets of data for this purpose: total income, which is the income you actually receive, and taxable income, which is the income you pay tax on. Anyone who knows the tax stats knows that these two can be very different. Each year when the figures come out, Peter Martin of the Age amazes and infuriates us by detailing how dozens of people with incomes of more than $1 million a year end up paying no tax at all. Why? Because their tax advisers use all the lurks they can to reduce their taxable incomes to more or less zero. If you want to find out about real incomes, taxable income is the wrong measure. It might make no difference to the outcome, but I would like to see Grattan redo its numbers using total income instead.
The second caveat: the first version of the tax statistics is always incomplete, because quite a few taxpayers have yet to settle their tax returns — and they are disproportionately high-income earners.
Even after correcting for these, Grattan’s overall conclusion could well be right, and it will take more work to understand who, where and why. But a second part of the income story is not in dispute — as Grattan points out, urban incomes are significantly higher than regional incomes. In Victoria, for example, the 2016 census found the median income per head in each region was $53,439 for regions in Melbourne (the figure for Whitehorse East, centred on the eastern suburb of Ringwood), which was 24 per cent higher than the median for rural regions ($42,931 in Wangaratta and Benalla). When there is no longer a rising tide lifting all boats, these differences matter more. Those with less income have less scope to adjust when prices outgrow wages.
But you sense that the Grattan Institute wants to play down these differences. It makes only a brief mention of the most authoritative data source on incomes, the Bureau of Statistics’s biennial household expenditure survey, to tell us it shows that “inequality in post-tax incomes has not changed much over the past decade in Australia… post-tax household incomes have become a little less equal.”
Really? The Grattan report doesn’t give the figures. But here they are:
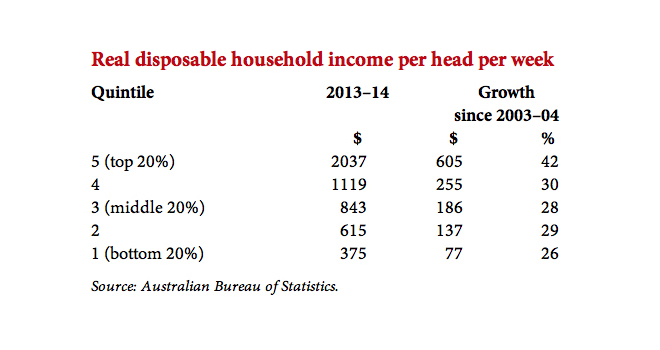
Inequality hasn’t changed much? Of course not — incomes have only grown two-thirds faster at the top than at the bottom. Nothing to see there, move on!
Nor did the report mention the changes in household wealth over the decade, which is a significant omission. Here they are:
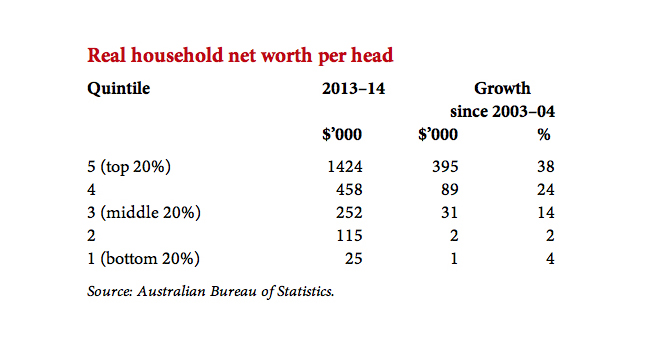
If you want to understand the household economy, you can’t ignore wealth — or the vast and growing disparity in its distribution. By 2013–14, the richest 20 per cent of Australians possessed 63 per cent of all households’ net assets; the 60 per cent from the middle to the bottom owned just 17 per cent.
In a decade during which, we’re told, not much changed, the wealthiest 20 per cent of households gained 76 per cent of all the increase in household wealth. The 60 per cent of Australians in the middle and at the bottom shared less than 7 per cent of the gains between them. The top 20 per cent gained 48 per cent of all growth in income. The 60 per cent in the middle and the bottom gained just 32 per cent between them.
It is this growing gap that has put inequality back on the political agenda for the first time since the 1970s. It explains why Bill Shorten and Chris Bowen feel confident that the politics will work for them when they target the rich for tax rises, pledging to close or narrow the loopholes that now allow them to corner such an outsize share of the nation’s income and wealth.
The Grattan Institute then went seriously off track on employment. “Employment outcomes are not obviously different” between cities and regions, we are told. “Income growth and employment rates are not obviously worse in regional areas… Given that people in regions have generally fared as well as those in the cities over the past decade, major parties may need to look beyond income and employment to discover why dissatisfaction among regional voters is increasing.”
Yet no employment figures are quoted in its report. Might I suggest that the reason the authors thought employment rates in the cities and regions were not “obviously different” was in fact that they hadn’t looked at them? Because anyone who did look at them would realise: Gee, Sydney and the bush really are different places!
Here are the figures, freely available from the Bureau of Statistics website. Over the 2016–17 financial year, on average, Sydney had 62.9 per cent of its adult population in work; the rest of New South Wales had only 55.6 per cent. In Melbourne, 62.8 per cent of adults had jobs; in the rest of Victoria, 58.8 per cent.
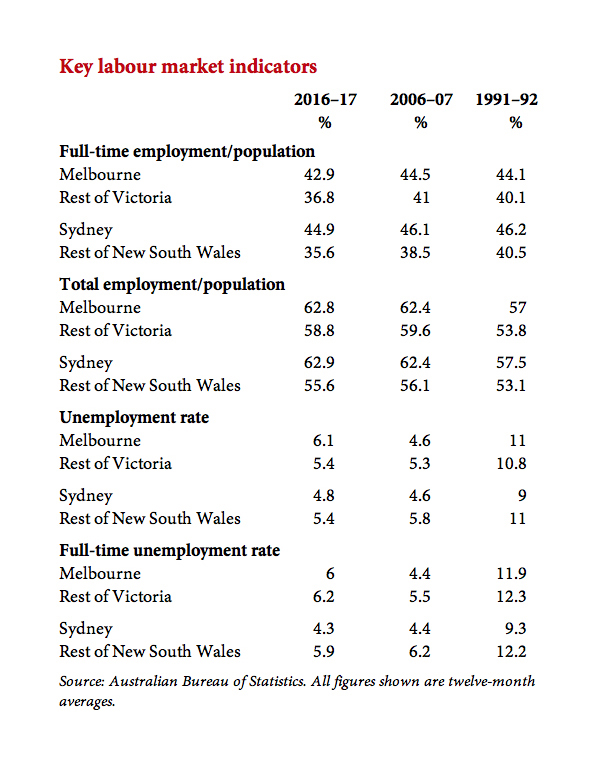
Moreover, that gap is not in part-time jobs. It is entirely in full-time jobs. In Sydney, 44.9 per cent of adults had a full-time job (or, for the young, a full-time mix of jobs); in the rest of New South Wales, only 35.6 per cent had full-time work. In Melbourne, 42.9 per cent were in full-time work; in regional Victoria, 36.8 per cent.
Pick up the weekend paper next time you’re in a country town, and look at the job ads. With rare exceptions, the majority of them will be offering part-time work. If you’re in a country town and you can’t live on a part-time wage, better head to the city.
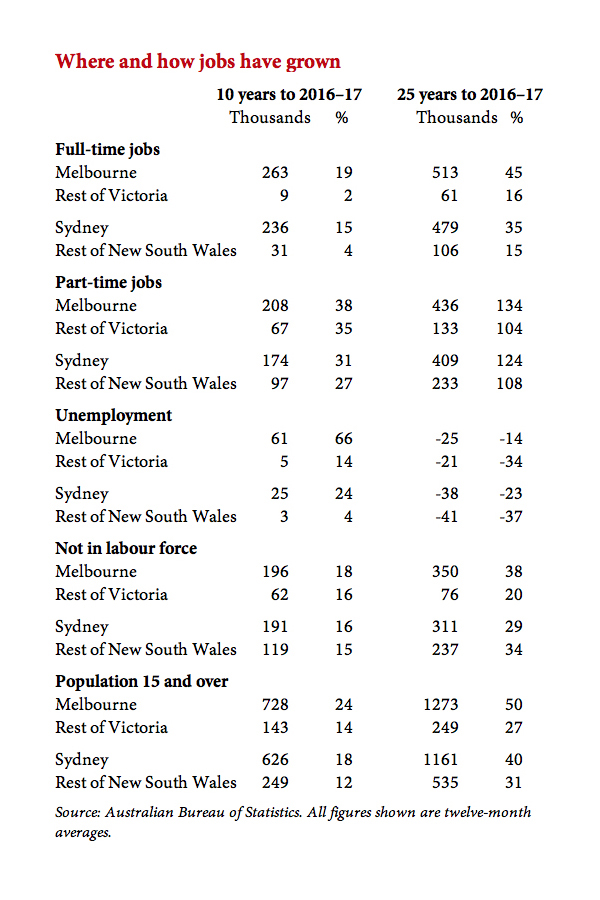
In the ten years to 2016–17, the Bureau figures show, Melbourne added 263,000 full-time jobs. The rest of Victoria added just 9000 — fewer than 1000 full-time jobs each year.
In New South Wales, it was similar, though less extreme. In the last ten years, Sydney added 236,000 full-time jobs; the rest of the state just 31,000. Employment outcomes between city and country are very different.
The Grattan Institute looked only at unemployment figures. And yes, they are roughly similar. In 2016–17, averaged out over the year, the real difference was between Sydney (4.8 per cent) and Melbourne (6.1 per cent). It’s another sign that Melbourne’s population growth has seriously exceeded the city’s capacity to cope.
But unemployment figures can be low for different reasons. In Victoria’s labour-market regions, for example, the Bureau of Statistics figures show that the lowest unemployment rate in 2016–17 was in Bendigo (4.1 per cent); yet over the past two years, it says, that region has lost 2200 jobs. Next door in Victoria’s North-West, unemployment is below the national average at 5.1 per cent — yet over the past two years, if you believe the Bureau’s figures, it has lost 8100 jobs, or 10 per cent of its workers.
By contrast, the areas shown as experiencing rapid jobs growth — Geelong, Shepparton and Melbourne’s inner east, outer southeast and outer northeast suburbs — all had higher unemployment rates, of between 5.7 and 6.7 per cent. In regional areas, unemployment rates are no guide to jobs growth.
Why not? Because if people with families or aspirations can’t find suitable work around them, they move. The Wimmera region of western Victoria, for example, has been losing population for decades, yet its unemployment rate is almost always below the state average. The young see no prospect of having a decent career if they stay, so they move.
The census illustrates this. These are the relative numbers of ten- to nineteen-year-olds recorded in Victoria in the 2006 census, and the twenty- to twenty-nine-year-olds recorded in 2016:
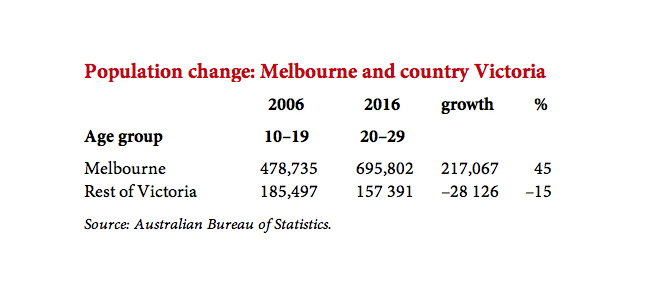
The boom in Melbourne’s population of twenty-somethings is mainly due to immigration by overseas workers and students, with migration from the bush and from other states as secondary factors.
But the “rest of Victoria” also includes the university campuses at Geelong, Ballarat, Bendigo and so on. It includes all the young commuters who have settled within 150 kilometres of the big smoke, where land is cheap. Yet even so, that cohort in regional Victoria shrank by 28,126, or 15 per cent, in the decade. The second batch of census figures later this year will give us precise figures, but it’s clear that tens of thousands of young Victorians have moved from regional Victoria, and one can fairly assume that lack of jobs is the main driver.
My sharpest memory of my last trip to the Wimmera was the sad sight of a deserted footy ground, now all weeds and tattered signs, in a small town where there are no longer enough young players to field a team. It was a symbol of the gradual breakdown of communities as the young move away to find work.
And we have seen before that crumbling incomes and social structures in regional areas lead to savage protest votes against governments that give priority to economic “reforms.” Two governments highly regarded by economic reformers lost office in the 1990s because they targeted regional areas for cuts to services, assuming their supporters were rusted on and would never support Labor — only to find that they weren’t, and they would.
In 1991, after three years of austerity stripped benefits from country and city alike, the Greiner government in New South Wales was expected to be re-elected comfortably. Instead, it lost nine seats and pro-Coalition independents lost another three. All but three of the twelve seats were in regional areas — from Bathurst to Port Stephens, from Tamworth to Broken Hill. The Coalition limped on as a minority government for four more years, losing Greiner along the way, then Labor won power for the next sixteen years.
There was a lesson there for Jeff Kennett — and his National Party allies — in Victoria, but being the Jeff he was then, he ignored it. His tough-minded reforms won adulation from business and commentators: scrapping 50,000 public sector jobs, selling off Victoria’s electricity, gas, and country railways, cutting the number of local councils by two-thirds, reducing taxes.
But tens of thousands of jobs were lost in country areas, and the government’s focus was on Melbourne. In the seven years of the Kennett government, in net terms, Melbourne added 242,000 full-time jobs — and regional Victoria lost 7000. Regional Victoria had fewer full-time jobs when the Kennett government left office than it had when Labor left power.
In 1999, Kennett was dumped from office — not by Melbourne, but by regional Victorians. In the big smoke, the Coalition lost only six of the thirty-six seats it had won in 1992. In regional Victoria, it lost twelve of its twenty-six seats, some of which were thought unlosable: Mildura, Gippsland East, Gippsland West. One Nation never took hold in Victoria; these seats were lost to independents, others to Labor. The revolt of the bush cost the reformers office.
Is this sounding familiar? In two weeks’ time, the Bureau will release its updated estimates of inequality. Those who wish the issue would go away will have to deal with the realities. We can learn the lessons of the past, or ignore them and take the consequences. •