We focus too much on what is immediate, too little on the longer-term changes that shape our choices. So much time and intellectual energy is wasted analysing the latest data for little twists that might marginally change our future. Too little is spent looking back over the longer haul, to see where we have been heading, and why.
The December quarter national accounts released by the Australian Bureau of Statistics last week were not too good, but not too bad. Essentially, the accounts show the economy is stuck in third gear. The output of the economy (gross domestic product, or GDP) grew by just 2.3 per cent in 2017 — or 0.7 per cent per head, which is really the more important number. It’s been like that for the last five years, as these numbers show:
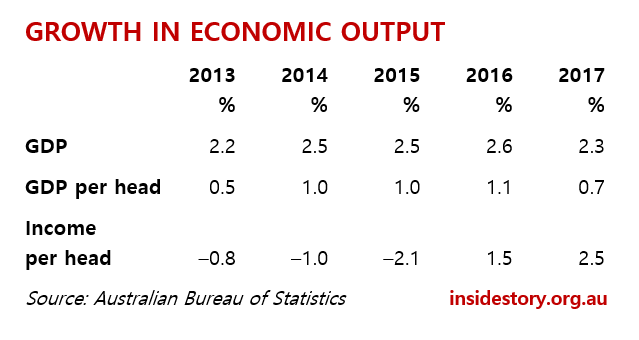
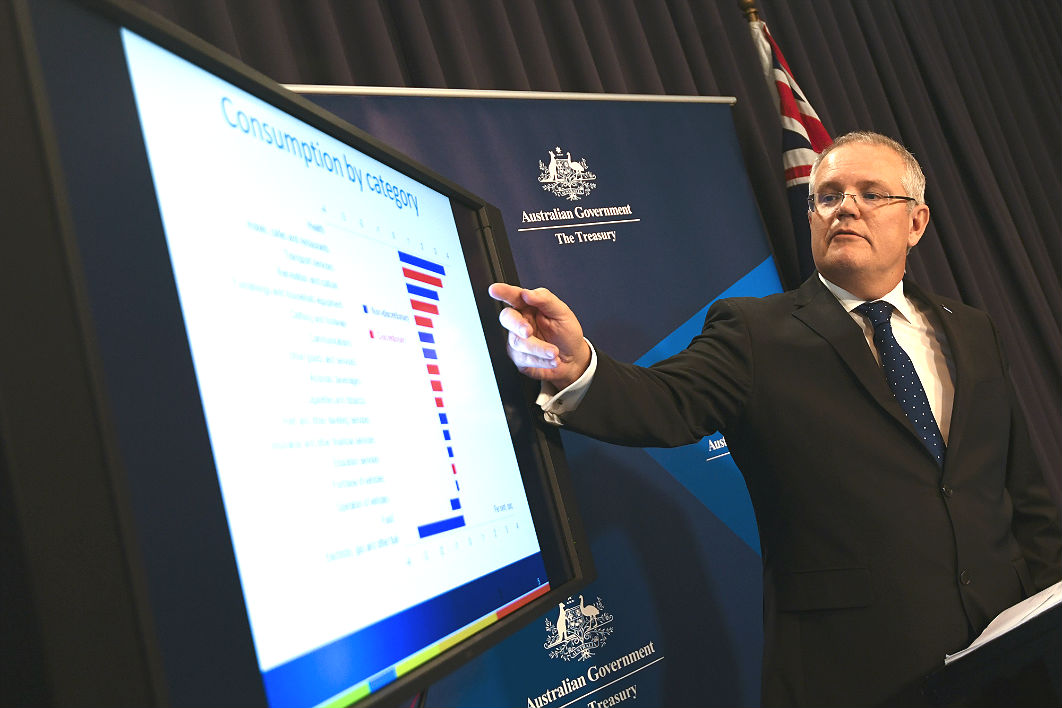
Apart from the income measure, which rises and falls with mineral prices, it’s hard to get excited by figures like these. That’s why treasurer Scott Morrison started his press conference by talking about the recent growth in jobs, which is not in the national accounts but at least was “good news.”
But there are much more interesting and important figures in the national accounts. They help explain much more clearly where the economy is, why real wages are flat while household debt is soaring, and why the burden of debt and low-income growth is likely to be a brake on the economy well into the future.
The figure that leaps out from the data is the ten-year growth in that bottom line: GDP per head. Here it is, over the past sixty years:
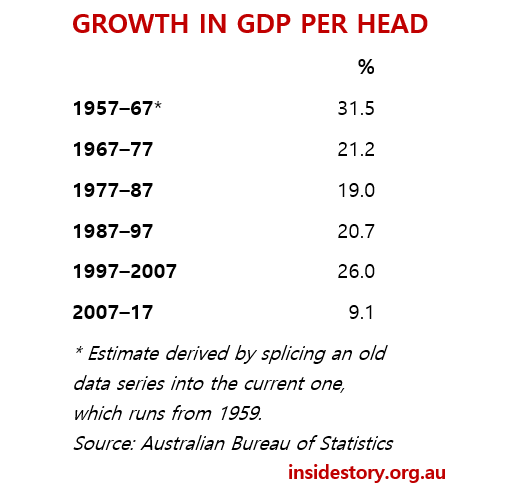
One decade stands out, doesn’t it? Since the national accounts began in 1949–50, we’ve never had ten years as bad as the last ten. Some insist that we escaped recession during this period, and even the International Monetary Fund, which ought to know better, has just claimed that we had “robust” growth.
Far from it. The latest growth figures for the European Union imply that Australia’s per capita growth would put it second-lowest in the twenty-eight-member group. Year on year, the EU’s output shot up 2.5 per cent last year, which is about ten times the latest estimate of its population growth. Its unemployment rate fell by almost a full percentage point, to 7.3 per cent. In coming months, it could well fall to a new record low, eclipsing the previous best since the EU expanded east, of 6.8 per cent, which was set in early 2008 as the global financial crisis was starting to break. Europe’s rebound is now an important driver of global economic growth.
It’s a very different story here. Indeed, over the past five years a third of Australia’s economic growth has come from net exports, as the mining cycle has shifted from import-intensive investment to production, overwhelmingly for export. Household consumption, so often the dynamo behind Australia’s growth, has grown roughly in line with GDP. Consumption per head has edged up just 4.5 per cent in the last five years, 9.5 per cent in the past decade. In the previous decade, it grew by 35.9 per cent. That is some shift.
It would improve policy discussion of these issues if officials, journalists and commentators focused far more on these longer-term trends, and less on the short-term flim-flam of quarterly and monthly movements. The Bureau of Statistics, Treasury and the Reserve Bank should give them prominent airplay, because figures like these help us understand where we are — and hence, what our policy choices are.
The reality is that Australia’s long-term economic growth has slowed abruptly. Almost a decade after the global financial crisis, we have not seen any significant improvement. Certainly, there were forces acting as a brake on the economy — the Reserve Bank allowed the dollar to become extremely overvalued between 2010 and 2014, reducing competitiveness across the entire economy, and the mining investment boom has been deflating gradually since 2012. Yet other forces, including extremely low global interest rates and China’s debt-driven growth, were pushing on the accelerator. It’s hard to argue that this was a particularly difficult period.
The Reserve Bank is forecasting that annual growth in output will accelerate to 3 per cent this year and 3.25 per cent next year — which, if correct, would imply a virtual doubling of growth per head. But similar forecasts in the past have proved wrong; no one has a crystal ball.
Of course, good things can happen unexpectedly. After so many disappointments, few foresaw that the European economy would rebound with the strength it has now. A year ago, no one that I know of was forecasting that Australia would add 400,000 jobs in twelve months, three-quarters of them full-time.
Yet when you look at job growth over the past decade, the 2017 surge in full-time employment appears to be a delayed and partial catch-up for all the jobs that weren’t created in the previous nine years.
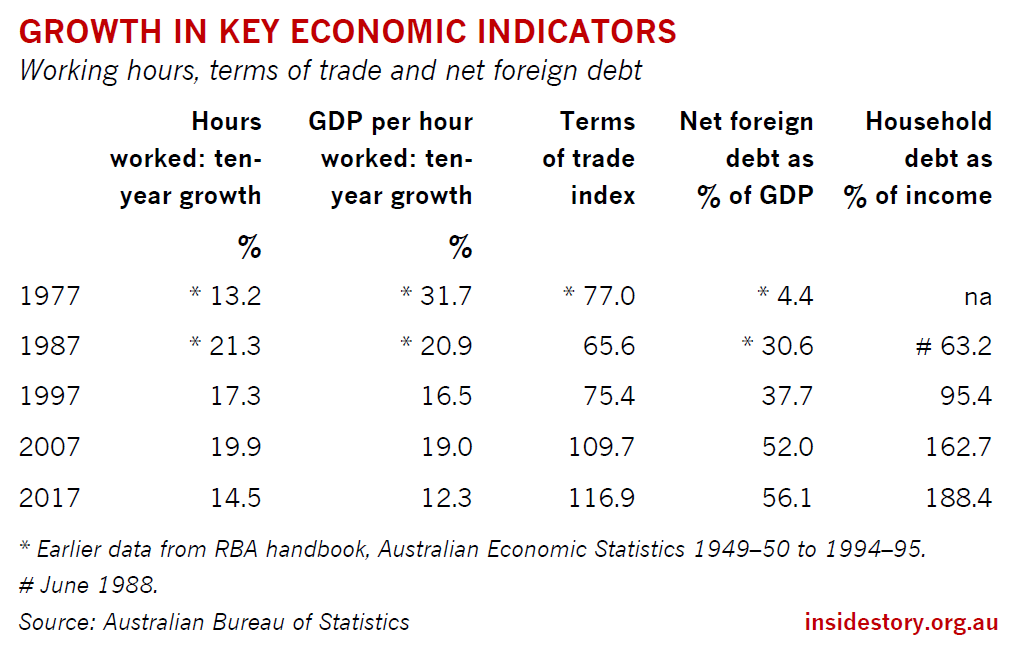
In every decade of the previous thirty years, on average, the economy generated 19.5 per cent more hours of paid work. In the decade to 2017, it generated just 14.5 per cent more paid work for us to do. Yet population growth was very much higher: 18 per cent in the past decade, 13.7 per cent on average in the previous three. The terms of trade — the prices we get for our exports, compared with the prices we pay for our imports — were never as favourable as they have been in the past decade.
So why weren’t more jobs created?
We can’t explain this long-term slump in job growth as the price we paid for rising labour productivity. On the contrary, our growth in output per hour worked was the lowest recorded over a decade since this series began forty years ago: 12.3 per cent for the economy as a whole, down from 18.8 per cent over the previous three decades.
Labour productivity grew significantly more in the market sector (the private sector and government-run businesses), at 19.3 per cent, but that came with even less job growth. In the parts of the economy that have to pay their own way, hours worked grew just 9.1 per cent in ten years — about half the growth rate of the population.
The real key, in my view, is in the last two columns. In the thirty years from 1977 to 2007, Australians were borrowing heavily, and spending it. In 1977 net foreign debt was 4.4 per cent of GDP; by 2007, it was 52 per cent of GDP — all of it, money that will eventually have to be paid back out of the nation’s future income. That wouldn’t have mattered had we invested it in projects that would earn the export income to pay for it. But the vast bulk was borrowed by the banks and fed into successive waves of speculation that pushed up house prices and debt. In 1977, if my memory is right, our total household debt amounted to about 35 per cent of our disposable income. By 2007, it was 163 per cent of our income. And every year we were borrowing more.
That couldn’t last. And for six years from 2007, it didn’t: the household debt–income ratio remained more or less flat, as Australians adjusted to their increasing debt burden by spending less and saving more. House prices enjoyed a period of relative stability: in the five years to December 2012, prices of established homes rose just 15 per cent in Sydney, 18 per cent in Melbourne and 12 per cent across all capital cities. It seemed the bad old days were behind us.
But the Reserve Bank knew that every mining investment boom since the war had ended with Australia crashing into recession — and this was by far the biggest mining boom of all. With no leadership coming from Canberra, the Reserve Bank chose to slash interest rates to stimulate the economy with another borrowing binge, as the lesser of two evils. Foreign debt and household debt soared again. In the five years to June 2017, house prices shot up by 81 per cent in Sydney, 58 per cent in Melbourne and 50 per cent across the capital cities.
The strategy worked. It brought on a boom in housing construction as well as house prices, and sparked an increase in non-mining investment. Australia did not go into recession.
But it has left Australia and Australians even more vulnerable when interest rates rise — as they inevitably will. Many Australians are now unable to buy a home of their own, and many more are paying so much on their mortgage that they have to keep a tight rein on discretionary spending. The Reserve has also tied its own hands, since the vulnerability of household finances will limit its scope to raise interest rates in future without tipping the economy into recession.
The national accounts provide another perspective on the decades of Australia’s debt-driven growth: the very different fates of different industries. The Bureau of Statistics divides Australia into twenty industry groups, including home ownership as one of them (to estimate the value provided by housing to its owners, whether owner-occupiers or landlords). Over the twenty years to 2017, in real terms (excluding inflation) six industries generated more than half the growth in the Australian economy. They were:
Finance — $88.4 billion, or 138 per cent
Health and welfare — $73.5 billion, or 148 per cent
Construction — $73.0 billion, or 133 per cent
Professions — $70.8 billion, or 151 per cent
Mining — $59.0 billion, or 140 per cent
Home ownership — $52.0 billion, or 54 per cent
By contrast, the output of Australian manufacturing — until 2005, the biggest industry in the country — grew slowly in the first decade, peaked on the eve of the global financial crisis, then sank by 15 per cent, losing $16 billion of annual production, before a marginal rebound last year. The decline of manufacturing was promoted by the Reserve Bank and cheered by naive economists. But it has shrunk Australia’s potential output, its exports, and its capacity to diversify away from reliance on mining.
Several things stand out from this list. Of the six dominant growth industries, only mining has a global focus. Finance was the biggest growth sector between 1977 and 2007, and its lending has gone mostly to homeowners; between them, they have generated roughly 20 per cent of Australia’s growth in the era of economic liberalisation.
Construction grew strongly between 1977 and 2014, led by the mining investment boom, but extending more widely to include increased supply of housing, commercial developments, hospitals and, to a limited extent, urban infrastructure. Construction has strong links to other industries — professional services, manufacturing, transport — so a growing role for construction is positive for the whole economy.
One reason for Australia’s slow economic growth is that construction activity has declined since 2014, with the deflation of the mining boom in outback Western Australia and Queensland outweighing the rising activity in apartments and infrastructure in Melbourne, Sydney and other capital cities.
Between 2007 and 2012, most of the growth in domestic demand (total spending in the economy) was in Western Australia, Queensland and the Northern Territory, driven by mining investment. Between 2012 and 2017, growth in domestic demand has been concentrated overwhelmingly in Melbourne and Sydney — in that order, despite endless spin from the NSW government to convince us otherwise — partly because that is where the construction is booming and lifting activity in other industries, often labour-intensive ones, and hence sparking the jobs boom.
The professions have had the fastest growth of all over the past twenty years, and I would love to know where it is happening. All the Bureau tells us is that 20 to 25 per cent of the professionals work in the area of computers; I suspect that the largest number of the rest are in law or accounting firms, and that the professions have also been swollen by our obsession with real estate and, more recently, by the boom in urban construction.
Twenty or so years ago, treasurer Peter Costello predicted that these professional services would become one of our main export strengths into Asia. It seemed likely at the time, but it hasn’t turned out like that. It would be worthwhile for the government to commission a serious, honest inquiry into what is holding us back.
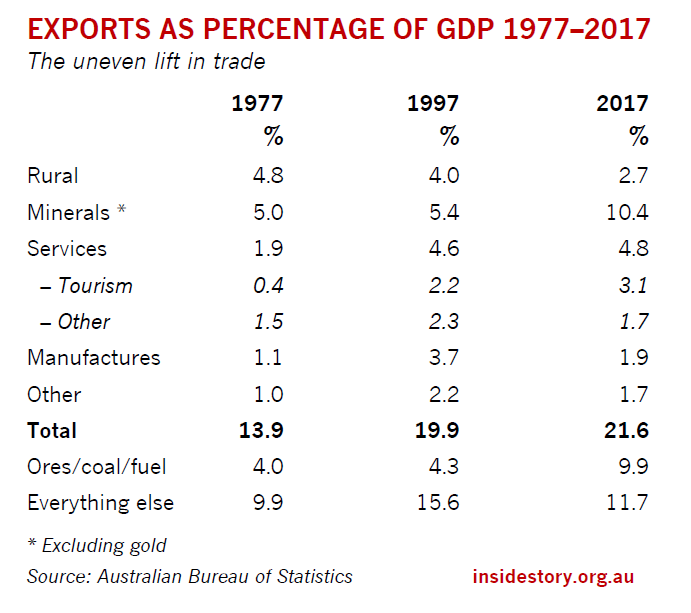
While service exports have grown marginally as a share of GDP since 1997, that has been entirely due to what is broadly called tourism — including the massive expansion of Asian student numbers in Australian universities, schools and colleges. Exports of all other services, including those professional services, have actually shrunk significantly as a share of the economy, from 2.3 per cent of GDP in 1997 to 1.7 per cent now.
Economists have written about the “resource curse” — the drag on the rest of an economy when natural resource exports are booming — and the experience of other export sectors (apart from tourism) bears this out. Between 1987 and 1997, our export volumes doubled across almost every sector. Since 2007, though, more than half the growth in export volumes has been of unprocessed metal ores and fuels.
Rural exports have rebounded from the long drought of the noughties, and education is booming. But exports of manufactures, processed metals, wine, gold and services other than tourism have barely grown at all. In per capita terms, they have shrunk significantly, turning around the growth that seemed so promising twenty years ago, after Paul Keating had urged business to become “enmeshed” in Asia.
These are some of the reasons why Australia’s growth has not been “robust” compared to its own past, or even to other Western countries today. When the government tells us that cutting company tax rates is its strategy for growth, that tells us it really has no long-term strategy, in the sense that the Hawke and Keating governments had one.
Australia has become an economy burdened down with debt. The burden may feel light now, with interest rates so low, but as they rise it will become heavier, and slow our capacity to grow. It’s easy to grow fast when you are borrowing other people’s money and spending it. It’s much harder when you have to pay it back. ●