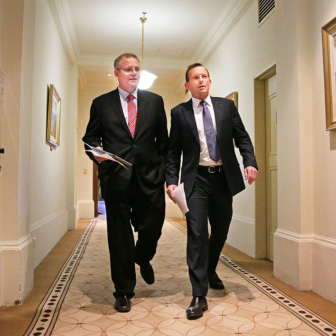
In March 2016 Terry Hughes pulled up at a lavish cane farm near Mossman, an hour north of Cairns on the northeastern tropical coastline of Australia. He stood on the lawn next to the small red helicopter, owned by a tour operator, that typically squeezed in four tourists along with a tour-guide pilot for a “heart-racing helicopter ride that is the ultimate in fast-paced luxury… with spectacular aerial views providing the vantage point for a king or queen of the skies.”
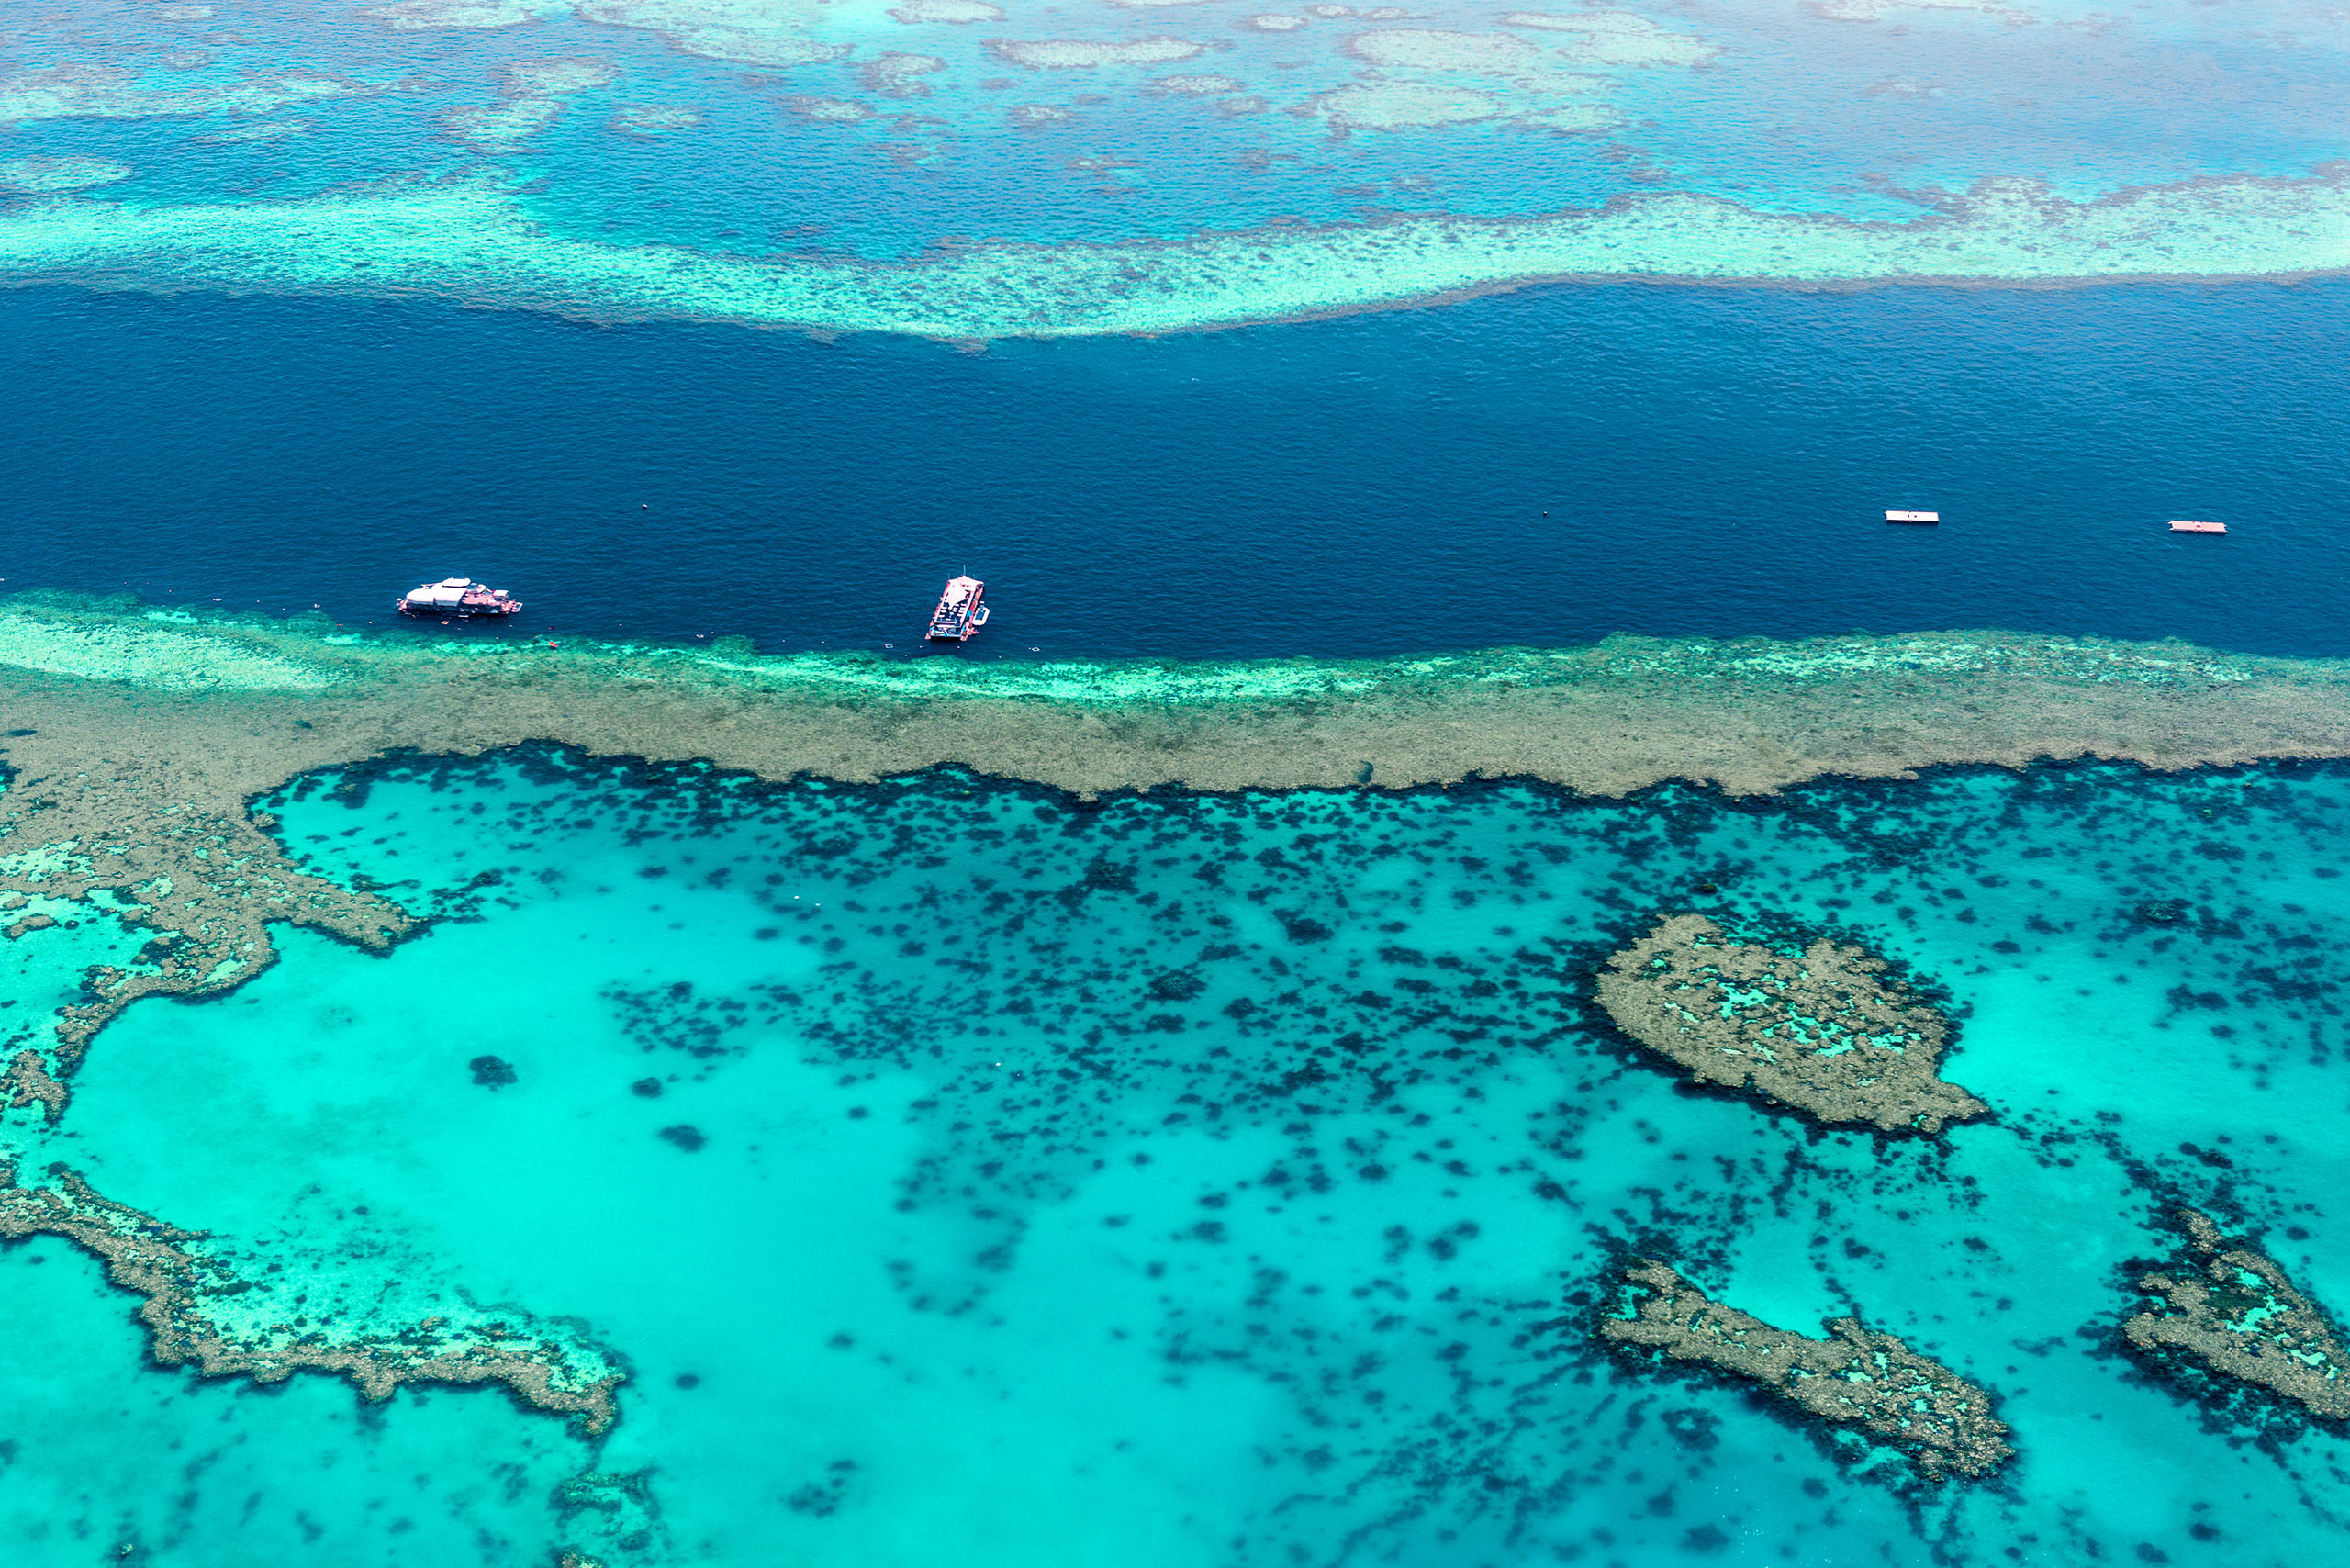
Hughes had chartered the helicopter, and the pilot would today be taking him and his assistant James Kerry on a flight that most tourists would strive to avoid. Like the TV crime shows in which a family member is led into a morgue to identify a dead loved one, Hughes knew that the task ahead of him wasn’t going to be luxurious or even resemble a typical day in the life of a marine scientist. Following a record hot summer in which warm sea waters had driven a massive global episode of coral bleaching, they were flying low over the Great Barrier Reef to map bleached coral.
Wind rushed, the engine roared and Hughes clutched his digital SLR camera as the rotor blades lifted them above sugar cane.
Coral bleaching is caused by ocean warming, driven by global climate change. Corals bleach when they get stressed and expel the colourful algae living inside their skin. It’s these algae that provide corals with most of their food and energy. Without them, corals turn white, providing a sinister signal that can be seen from above. If they stay bleached for long enough, they die and become overgrown by darker seaweed.
People monitoring reef health have a short window of opportunity to observe the extent of any coral bleaching before corals either regain their coloured algae and recover, or die and become overgrown. Someone had to act quickly if the full extent of the hot summer’s impact on the Reef was to be known.
El Niño climate cycles drive extreme, extended warming off the northeast coast of Australia every five or so years, adding to already increasing temperatures. This was the case in the summer of 2016 when the seas got warmer and warmer. Hughes, director of the Centre of Excellence for Coral Reef Studies at James Cook University, saw the warning signs of a hot summer as early as November 2015 and convened the National Coral Bleaching Taskforce, a loose network of university researchers, government scientists, the US National Oceanographic and Atmospheric Administration, or NOAA, and the Great Barrier Reef Marine Park Authority.
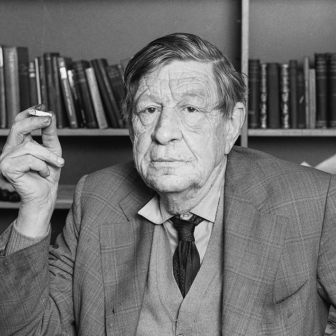
Throughout his career, Hughes has been driven by the desire to support effective ocean governance with high-quality science. If you met him in the street, you might guess he was a science professor — his sturdy frame is topped by unruly brown hair, expressive eyebrows, and glasses, and he has a fondness for woollen V-neck jumpers. If you stopped for a chat, you would find a precise man who delivers his words carefully and deliberately, paying attention to detail.
Originally from Ireland, Hughes embarked on a career as a marine biologist more than thirty years ago. Arriving in Australia in 1990, he built the research centre in Townsville by the central Great Barrier Reef, where his group focused increasingly on the impacts of climate change on the ocean.
Hughes and Kerry flew at a height of 150 metres above the reef for their coral bleaching surveys. Altogether, it would take eight days of criss-crossing over the 2300-kilometre length of the Reef, surveying the extent of whiteness that had spread across the previously colourful surfaces of 1156 reefs. Approximately a hundred researchers worked below the water, meanwhile, getting around on boats and staying at marine research stations to carry out underwater scuba surveys for a month.
Hughes surveyed individual reefs that ranged in size from tens of metres to several kilometres across. He assigned a coral bleaching score to the different zones of each reef using a scale that went from 0 (negligible bleaching) to 4 (severe bleaching). Other members of the taskforce examined 260 sites underwater to provide a close-up picture of which corals were bleaching and extend their observations reliably into deeper water depths, while the aerial surveys focused on the shallow reef tops. Records of coral bleaching from underwater surveys were later compared with aerial survey scores in a “ground truthing” exercise, so that the aerial data could be plotted out into a reliable digital map.
The work was intense. Hughes recorded rapid-fire information about what he was seeing into a microphone for up to eight hours a day. He announced the name and number of each reef before scoring the extent of the bleaching across the different zones. Flying over an individual reef, he would hurriedly report, “The crest is a four, the slope is a two,” often with about two seconds of flying before the next reef approached.
This was a thoroughly modern mapping campaign. As Hughes bore witness to the largest known coral bleaching event on the Great Barrier Reef, he reported depressing statistics in live tweets: “Day 3: 400 reefs scored by lunchtime. FOUR of them have no #bleaching.”
It was heartbreaking to sit in an aircraft and fly over a reef where 80 per cent of the coral was well on its way to dying. At the peak of summer, many coral tissues had simply melted away. They cooked.
It was also an assault on Hughes’s physical senses. The helicopter’s perspex dome roof focused the sun’s rays so that it was like flying towards the tropical sun in a greenhouse. The team had to put on sunscreen repeatedly. At one stage, they left the helicopter doors behind in the canefield as a novel form of “air conditioning”; they wore headphones to shout at each other over the engine noise, which left them partially deaf by end of day. They sat in the cramped cabin on jerry cans full of petrol for remote refuelling that released nauseating vapours slowly over the flight. When they finally found an unbleached reef after three days of flying, they cheered.
“We were tired and emotional,” Hughes recalled. “They were long gruelling days, the helicopter was noisy and hot, you had to have good bladder and bowel control.”
All records were compiled after the surveys. Scores were plotted up into what became a notorious traffic-light map illustrating coral bleaching down the entire length of the Great Barrier Reef. It was a depressing message of widespread coral distress and likely death to follow. The red northern sector, which had previously been thought of as the most remote and pristine section of the reef, indicated severely bleached reefs. Up to 80 per cent of live coral had disappeared from reef crests there. The amber central sector indicated a moderate level of bleaching, and the southern sector, being less severely hit, was coloured green, even though only 25 per cent of reefs escaped bleaching there.
The Great Barrier Reef is made up of over 3000 individual coral reefs. To the best of our knowledge, it first underwent mass coral bleaching in 1998, though an earlier mass bleaching event could have gone unnoticed. These events are now getting more frequent, having occurred in 2002, 2016, 2017, 2020, 2022, 2024 and 2025.
When the first couple of bleaching events hit, there were fewer marine biologists, and not many had seen coral bleaching. Ray Berkelmans coordinated early aerial bleaching surveys on the Great Barrier Reef in 1998 and 2002 with limited funds. He worked from the Great Barrier Reef Marine Park Authority and then the Australian Institute of Marine Sciences over smaller areas, with limited measurements taken in the water. Hughes was keen to do things differently in 2016.
Many of Australia’s reefs are exceedingly remote and seldom visited. Hughes didn’t want them to be out of sight and out of mind at a time when they were vulnerable to bleaching and possibly dying.
The National Coral Bleaching Taskforce’s job was to closely monitor coral bleaching across the whole of the country, an area extending some 6500 kilometres from offshore territories like Cocos (Keeling), off the west coast in the Indian Ocean, to the eastern extent of Lord Howe Island in the Pacific Ocean, and ranging up to Torres Strait in the north.
Berkelmans had learned practical lessons from those early aerial bleaching surveys. He stressed that the timing of surveys was critical because there is only a short period in which observations can be made: the time when the bleaching is at its most advanced stage and before major coral mortality sets in. If you set out too early, you may not capture the bleaching’s full extent; any delays might mean dead corals grown over by algae were not identified.
Two helpful factors enabled Hughes to send forth an armada of people to act at short notice. First, they had some reliable early warning systems, including forecasts from the Australian Bureau of Meteorology and the NOAA Coral Reef Watch tool, which used satellites to track environmental conditions that trigger bleaching. They also had temperature loggers stationed in the water and received reports of coral bleaching seen by people out on the Reef on a day-to-day basis. Collectively, this information enabled them to quickly identify areas at risk. Second, Hughes had worked for almost thirty years within Australia’s marine science community, and he drew trusted collaborators together into a small, efficient team that was free from the bureaucracy and constraints of larger institutions.
In the third week of March 2016, just after the peak of maximum oceanic heat exposure, they set off to survey the reef at the exact time when it mattered in the immediate aftermath of a coral bleaching event.
“We were able to do the job properly and grasp an opportunity to answer questions at scale in a way that very few research groups or organisations could attempt,” Hughes said.
Scientists’ understanding of coral bleaching had been growing for some time. The earliest known published account of thermally induced bleaching came from Low Isles in the central northern Great Barrier Reef, where members of the 1928–29 Great Barrier Reef Expedition observed whitening of corals in warm pools, which they considered to be a natural, seasonal event during summer months. Coral mortality was later reported during the 1982 mass bleaching event almost 200 kilometres further north in shallow waters at Lizard Island, and linked to high levels of ultraviolet radiation at times of elevated water temperatures.
By the 1999 mass bleaching event, concern among the coral-reef science community was growing. Professor Ove Hoegh-Guldberg recognised the broader link to increasing levels of atmospheric carbon dioxide, and raised the alarm that global warming would likely exceed the thermal tolerance of many corals, leading to unprecedented levels of coral bleaching by 2050.
The National Coral Bleaching Taskforce articulated a list of research questions to fill knowledge gaps: Of the range of possible drivers, what was the main cause of coral bleaching events? How did the composition of coral species within a reef community change after a bleaching event? What were the implications for coral recruitment and the ecological function of the reef? Answers would come from the maps they made.
The aerial surveys yielded dynamic data in the form of a digital map depicting the geographical footprint of coral bleaching along the full length of the Reef. The traffic-light map was generalised for the public to convey a simple message, but underlying those colours were thousands of individual coral bleaching scores attributed to different zones across hundreds of reefs. This finer-scale detail in the digital map data opened up valuable opportunities to investigate how the different kinds of corals respond to bleaching on the Reef.
Analyses drawing directly on the maps were published in six journal papers, five of which were in the top disciplinary journals of Nature and Science. The first paper came out in early 2017, just as Hughes was boarding a plane to observe the second consecutive bout of coral bleaching. It showed the coral bleaching map and the heat exposure maps side by side to reveal the distinctive gradients in both coral bleaching and ocean warming. The geographical patterns of heat exposure and coral bleaching were almost identical.
This was visually compelling confirmation that coral bleaching was primarily driven by warming seas. Hughes was out of reach for the media storm that erupted. Four thousand news articles reported on that first study, many of which reproduced the traffic-light coral bleaching map.
It was textbook geography. Accompanying plots explored the statistical relationship between the two maps by extracting data points from the same location on both maps to determine the influence of one mapped phenomenon on another. It was a simple yet elegant way to compare the two phenomena based on their geographical distribution.
It seemed to me that not only was expressing all of that data in a map visually arresting, but it conveyed a simple message quickly and with scientific authority. The marine scientist was carrying out geographic inquiry without realising it. When I prompted him about how the similar geographical patterns of coral bleaching they had mapped enabled links between the two phenomena to be numerically modelled, he laughed: “I remember after that 2016 bleaching event that you correctly accused me of being a geographer!”
It was already known that coral bleaching was caused by warmer seas, but the extent to which other factors played a part was less well understood. The coral bleaching maps from 2016 were also placed alongside other maps showing the spatial patterns of phenomena such as nutrient concentrations, water turbidity and fishing pressure. The severity of bleaching consistently correlated strongly with the level of local heat exposure, as indicated in satellite images of sea surface temperatures.
Damage caused by coral bleaching is measured by comparing live coral cover on a reef before and after a bleaching event. For this, direct observations of corals from underwater surveys is needed. But loss of coral cover is not the whole story. It doesn’t tell you which species or types of corals are dying, and which are surviving.
Many different types of coral live within the bustling ecosystem of a coral reef, and changes to the composition of the overall coral communities have profound implications. The complexity creates a three-dimensional structure that provides an important habitat for fish and other small creatures — sponges, worms, shellfish — which nestle in the nooks and crannies to hide from predators. Different coral species also have varying survival strategies. In terms of reproduction, some corals spawn, while others brood. Some grow fast to build up an underlying reef platform relatively quickly; others grow slowly and steadily. All of this has fundamental implications for the overall reef ecosystem.
After the early bleaching episodes in 1998 and 2002, almost nothing was known about changes to the species composition of coral communities. In 2016, Hughes’s taskforce collected underwater records from 169 reefs that identified shifts in the composition of coral communities, including the proportions of fast-growing and three-dimensionally complex staghorn corals versus flatter tabular and foliose corals. Later surveys would also reveal that a shift had occurred in the relative proportion of brooding and spawning corals, with implications for the subsequent recovery of coral communities.
The maps provided a basis for examining the quantitative relationship between a broad range of heat exposures and responses of the coral assemblages in more detail. Pairing underwater survey records with the digital maps revealed “collapse thresholds,” at which the ecological communities on the reef were suddenly irreversibly changed. Critical levels of heat exposure that trigger bleaching and mortality were identified. Associated changes to coral community assemblages could, in theory, be predicted geographically from ocean heat maps.
Hughes and his team carried out a global analysis of 100 international locations that revealed strong geographic patterns in the timing, severity and return times of mass coral bleaching. While bleaching events are caused by shortlived episodes of extreme heat, these are superimposed onto longer-term trends of warming that result in the increasing frequency of coral bleaching events from year to year. This upward trajectory of the baseline temperature means that coral bleaching is occurring more frequently.
As 2016 rolled into 2017, a consecutive hot summer delivered higher and longer-lasting ocean warming. Corals bleached for the second year in a row. The whole arduous mapping exercise was repeated to produce a 2017 coral bleaching map. This time, the central section was the worst hit, with many red dots indicating severe bleaching around Cairns. International news headlines warned that severe coral bleaching had hit two-thirds of the Great Barrier Reef.
The second digital map enabled questions to be answered about the ability of past events to influence the present trajectory of ecosystems. One study compared the 2016 and 2017 coral bleaching maps along the entire length of the Reef to better understand how the past history of bleaching influenced the reef’s recent bleaching response. It found the response of corals to heat stress during the second consecutive 2017 marine heatwave was transformed by a lingering signal that could be seen in the spatial footprint of the 2016 bleaching map.
Under similar levels of heat exposure, reefs that had been stressed in the previous summer were less likely to bleach during the second consecutive hot summer. This “ecological memory” appeared to increase the resistance of surviving corals, with a shift towards a more resilient community of corals that had already survived exposure to heat stress.
As 2020 and then 2022 added more digital map snapshots of the coral bleaching, yet more observations were made about how the reef responds to multiple bleaching episodes over time. The simple relationship between heat exposure and bleaching broke down as recurrent bleaching events changed the assemblages of corals living on reefs. Susceptible corals disappeared from the ecosystem to leave behind ones with increased stress tolerance.
As the coral communities living on each of the 3000 individual reefs became increasingly defined by their recent history of bleaching, so their subsequent response to future bleaching events was predetermined. The map with its thousands of data points became a moving mosaic of red, amber and green reefs in poor and relatively good condition.
The taskforce’s aerial surveys and mapping campaigns took place against a backdrop of rising tensions between the coal industry and those advocating on the environment. In 2016–17, the effects of climate change were being felt across Australia. Extended droughts had reduced agricultural production, and bushfires were burning intensely. Water shortages combined with toxic algal blooms to cause mass fish kills in the Murray–Darling river system, while the most extensive dieback of mangrove forest ever seen occurred along 1000 kilometres of the northern coastline in the Gulf of Carpentaria. Pressure was increasing on the government to take substantive action to address climate change by curbing fossil-fuel emissions.
As the first wave of bleaching unfolded in March 2016, federal environment minister Greg Hunt joined the Great Barrier Reef Marine Park Authority on a flight along 200 kilometres of coastline between Cairns and Lizard Island. Upon landing, he gave a press conference downplaying the significance of the coral bleaching. It was a story that stood in stark contrast to the maps of coral bleaching.
Hunt claimed that bleaching was restricted to a small area in the central north where the tourism industry is based. This ignored the immense areas of decimated reefs that Hughes had mapped in the far north stretching as far as New Guinea.
“I briefed the GBR Ministerial Council at that time and there were requests for copies of the data we used to make the map,” Hughes explained. “There were also a few raised eyebrows from people asking who is this maverick professor surveying the entire Reef? Why is he doing it and why won’t he shut up?!”
The federal government was concerned that they didn’t own the data and couldn’t control the flow of information to the public about the extent of the coral bleaching. As Hughes recalled, “They were certainly more comfortable with a government agency doing this sort of national business, as the message is controllable. Or the message doesn’t have to be issued at all… politically I was a loose cannon. I still am.”
The coal versus coral war became an increasingly polarised national debate about energy policy and the need to curb fossil-fuel emissions. Two years earlier, the government had supported a proposal by the energy company Adani to open up the Carmichael Mine, one of the largest coalmines in the world, in northern Queensland. This would require the Abbot Point coal port to be expanded, with millions of cubic metres of sediment dredged to make way for coal export ships. Plans to dump the dredge spoil near the port site inside the Great Barrier Reef World Heritage Area met with local concern about the effects on the seafloor life.
There was also the bigger, global problem of the additional fossil fuels that would be burned. This would contribute to climate change and warmer ocean waters; the major driver of coral bleaching as had been demonstrated by the National Coral Bleaching Taskforce’s analysis of their maps.
The maps also brought the growing threat from climate change to the Great Barrier Reef into increasingly sharp focus on the global stage. The Reef had received a badge of honour when it was declared a UNESCO World Heritage Site in 1981, in recognition of its outstanding universal value. This gave Australians reason to be proud of their iconic natural wonder, which provided income from more than 1.6 million tourist visits each year. Against this backdrop, the maps of coral bleaching on the Reef clearly demonstrated that characteristics for which it was initially designated as World Heritage were in danger.
The List of World Heritage in Danger is an international lever for reform to encourage better environmental stewardship of World Heritage Sites. The question of whether the Reef should be placed on the In-Danger list was first raised in 1997 as climate change emerged as the major threat to the Reef’s World Heritage characteristics. The question then cycled in and out of media attention as it was considered and reconsidered by the World Heritage Committee over several decades, while all the time the impacts of climate change on the Reef escalated. An In-Danger listing has so far been avoided by the Australian government through political and industrial lobbying.
Hughes’s maps of coral bleaching driven by climate change found themselves at the centre of this debate when they were cited in an independent report on vulnerability of coral reefs inside World Heritage Sites commissioned by UNESCO. The maps were a compelling scientific picture underpinned by robust data. They added to the growing body of evidence linking ocean warming driven by climate change to coral bleaching, and the UNESCO report highlighted the growing disconnect between Australian responsibilities for stewardship of the Reef and the federal government’s support of the fossil-fuel industry. •
This is an extract from Plotting the Oceans: Stories of Powerful Maps and Their Makers by Sarah Hamylton, published by Monash University Publishing.