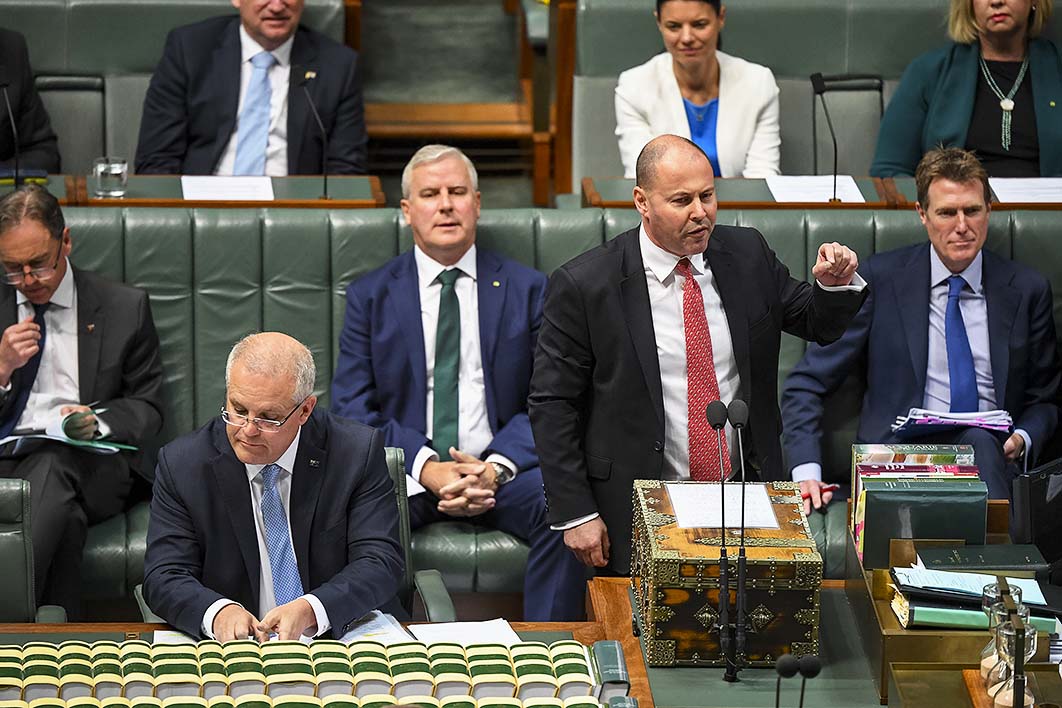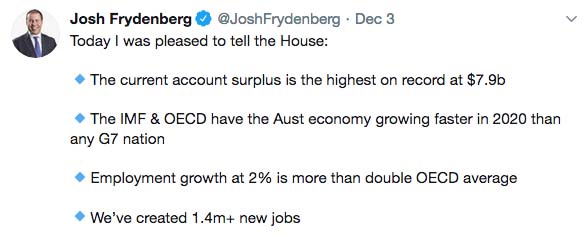
Yes, treasurer, that’s all correct. Australia’s exports, now mostly from mining, have never been more plentiful and profitable. The China–US trade war and other woes have pushed growth down in the big Western economies. Job growth is slowing while unemployment and underemployment are rising, yet the overall employment rate is at a record 62.6 per cent.
If you have a taste for ministerial spin, there was plenty more of it yesterday when the treasurer declared that the September quarter national accounts — which reported the economy grew by just 0.4 per cent in the quarter in seasonally adjusted terms, and 1.7 per cent in the year to September — showed that Australia remained “remarkably resilient” in the face of global and domestic headwinds. Again, nothing he said was wrong and some of it was even relevant.
But the game of politics these days is not about solving problems or even tackling them, but about making enough people think you are. The government can’t stop the Australian Bureau of Statistics releasing the full range of economic data, but it is very selective about what it chooses to notice.
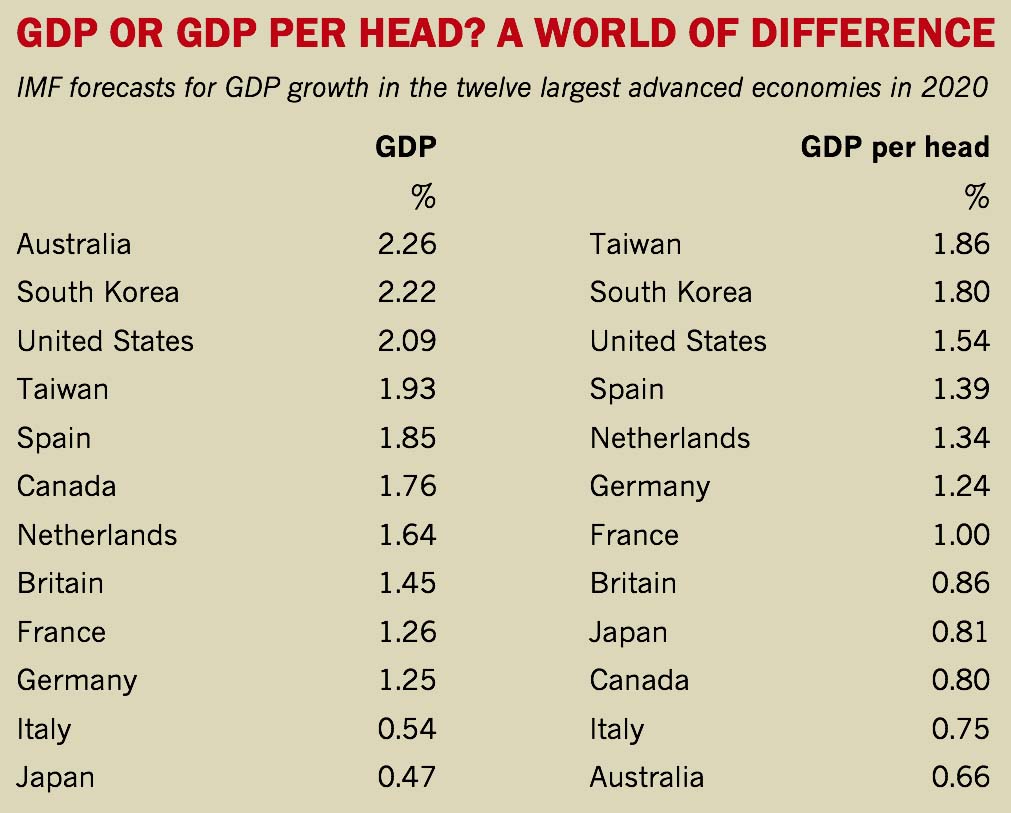
In fact, the International Monetary Fund is forecasting that in 2020 Australia will have the highest growth rate in GDP (gross domestic product) of any of the world’s twelve largest “advanced economies”: a feat it has achieved only twice in the past decade. The problem is that GDP growth is not the bottom line of economic success.
The real bottom line is GDP per head. That’s what makes Australia a rich country, whereas India — which produces eight times more goods and services than we do — remains a middling poor one. And when you look at the IMF’s forecasts for growth next year in GDP per head, Australia goes from the top of the list to the bottom.
Source: International Monetary Fund
It is not GDP growth that raises living standards, it is growth in GDP per head. The IMF predicts Japan’s output will grow by only 0.45 per cent next year. But the number of Japanese residents is forecast to shrink by 0.34 per cent (more than 400,000 people), so its output per head — not a bad measure of living standards — would grow by 0.81 per cent. On the measure that matters, the Japanese tortoise would outpace the Australian hare.
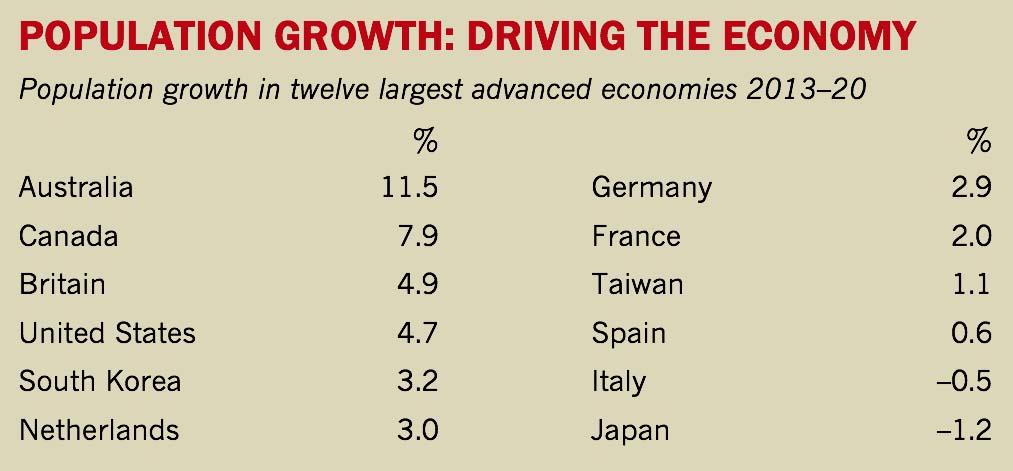
How could Australia top the GDP forecasts yet be bottom on GDP per head? Because its economic growth, such as it is, is driven by population growth. Next year the IMF forecasts Australia’s population to grow by 1.69 per cent. Of the others in this group of twelve, Canada is a distant second with 0.96 per cent, and Britain a very distant third with population growth forecast at barely a third of ours.
That difference is overwhelmingly due to immigration. Almost two-thirds of Australia’s population growth consists of overseas migrants: permanent, temporary or, in many cases, temporary until they become permanent. While the government has cut its official immigration target from 190,000 to 160,000, this has had no impact so far on the level of actual net migration, which is around 250,000 a year.
Some advocates of high immigration claim that it raises the rate of growth per head, and that anyone questioning its economic benefits must be doing so simply as a cover for racism. (For an alternative view, see a new paper by Bob Birrell and David McCloskey of the Australian Population Research Institute, which compiles detailed evidence to argue that a policy supposedly targeted at recruiting high-skilled workers is in fact increasingly resulting in migrants taking over low-skilled jobs that were once stepping stones for young Australians into the workforce.)
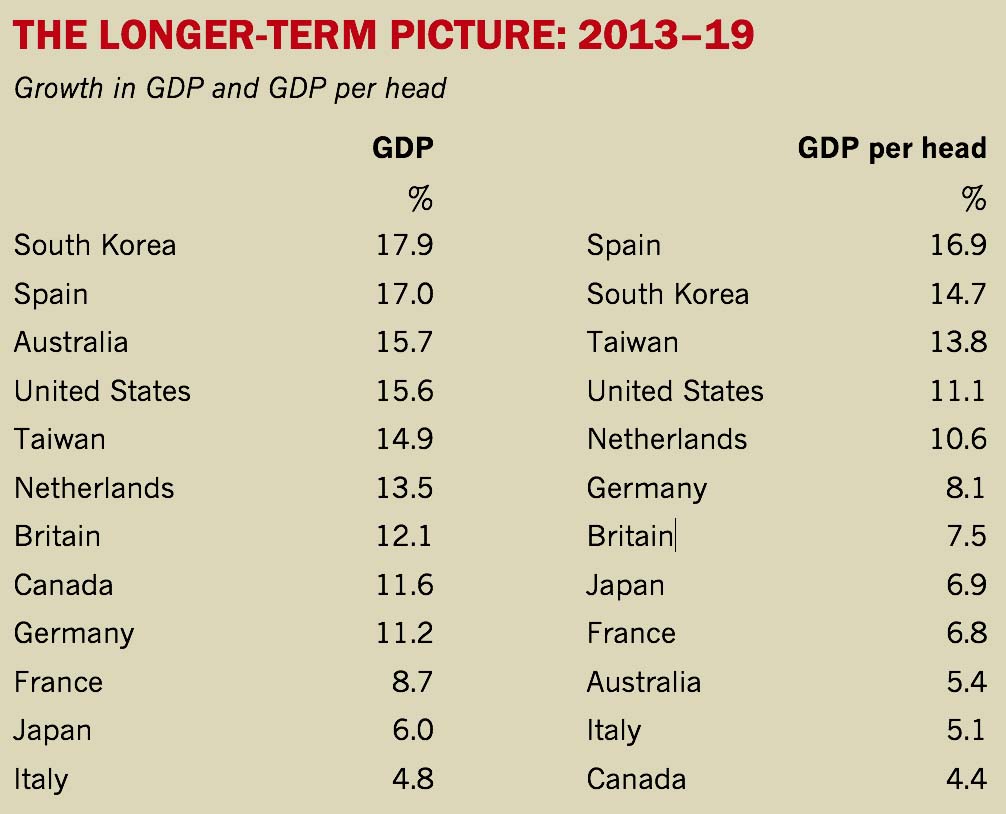
It is worth noting that the IMF data shows that Australia’s experience of high immigration has done anything but lift the economy: since 2013, when the Coalition was elected, Australia has had by far the highest rate of immigration and population growth of the big twelve, yet the third-lowest growth in per capita output.
Source: International Monetary Fund
Source: International Monetary Fund
This is not just a story about Australia underperforming in 2019 and 2020. As the IMF data shows, it has been underperforming for years. But that is a complex story, for another day.
The news from the Bureau of Statistics is not all bad, but the good news is in the margins. The bottom line is that the economy has grown by 1.7 per cent in the past year, while the population at last count was growing at 1.6 per cent. Quarterly growth was 0.44 per cent on the seasonally adjusted measure, 0.51 per cent on the trend measure: again, pretty similar to the rate of population growth. We’re not going forwards; we’re not going backwards.
What is really remarkable in the national accounts is the conflict between two sets of figures:
• Only half of the modest growth we experienced was in domestic economic activity. On the seasonally adjusted measure, domestic demand grew by a minuscule 0.2 per cent in the quarter, 0.9 per cent in the year. Roughly half the growth in the economy in 2019 has been in net exports. Export volumes and prices are rising, while import volumes are falling.
In the September quarter, in volume alone, exports climbed 3.5 per cent from a year earlier, while weak business investment saw the volume of imports sink 1.5 per cent. But with China once again driving up prices for our minerals, export earnings shot up 14.5 per cent from a year earlier, 33 per cent from two years earlier, and 64 per cent from their low point in 2016.
This is still the lucky country. China has decided to fight the US trade war by beefing up its smokestack economy, and here we are with the coal, iron ore and gas, just as our rival Brazil is fighting fires. Unfortunately what goes up will come down, some day.
• Our small growth in domestic demand was entirely in government spending. Total spending by business and households actually shrank by 0.3 per cent in the year to September — and remember, that’s by a population growing by 1.6 per cent. Household consumption grew by 1.2 per cent (and so consumption per head declined), but that modest growth was outweighed by plunging housing and engineering construction, which pulled total private construction down by 4.8 per cent.
• Instead, the growth in domestic activity came in government spending: above all, in day-to-day spending by the federal government. The most stunning statistic in the whole accounts is that in the September quarter, compared with a year earlier, the once-small federal government increased its consumption by $3.7 billion (10.1 per cent) while Australia’s ten million households increased their consumption by $3.2 billion (1.2 per cent).
That is not a new trend: this Coalition government has never been into reducing overall spending. Its cuts have rather shifted resources from areas it has little sympathy with — foreign aid above all, the ABC, universities and research, cultural institutions and so on — to pay for the National Disability Insurance Scheme and increase funding where it will reward or entice supporters.
On the trend data, the Coalition has increased its consumption spending by 42 per cent above inflation during its six years in office. In the same period, household spending has increased just 15 per cent, and state and local government spending by 16 per cent.
But one area of government spending has flattened out in the past year. The volume of government spending on infrastructure in the September quarter was just 0.16 per cent higher than a year earlier. Public sector engineering construction — mostly roads and rail — sank from $10 billion in the June quarter of 2018 to $8.5 billion a year later. The September quarter records only a small rise.
A lot of this goes against the mythologies promoted by both sides of politics. We keep hearing people say that to lift the economy, the federal government should spend more. Well, it already has — far more than I have seen any critics acknowledge — and the reality is that its increased spending has, at best, only partly offset the private sector’s decline.
It could spend its money better by directing more to those who need it and less to those who don’t. Many have pointed out that the most direct way to increase private sector activity is to lift Newstart, which is now so far below the poverty line that you can assume that — unlike the recent tax cuts — none of the extra dollars would be saved by its recipients.
But while the tax cuts received in the September quarter were not spent immediately, they will be spent sooner or later. Deloittes economic guru Chris Richardson put it well in his recent Budget Monitor: the federal government should be ready to break all its surplus promises to stimulate the economy in a crisis — but we’re not in a crisis yet, and hopefully we never will be.
Apart from booming exports, the other encouraging sign for the economy is the unexpected surge in household incomes. Total wage and salary income soared by 4.9 per cent from a year earlier, its strongest growth since 2011. That largely reflects the job boom I mentioned at the start of this article, but the Bureau also recorded rising individual wages. The wage drought has been a very long one, and one would be wary of calling its end, but this is a promising sign.
The economic slowdown will end when enough participants in the economy — government, business or households — decide to stop saving their pennies and start spending more. With business profits continuing to soar, those firms doing well are in the best position to take the long view and start investing. But the federal government needs to get its own bushfire action plan ready to roll out if nothing else works. •
