Preferences, specifically Newspoll ones, have been in the news a bit lately, or at least that small corner of the news where lurk the politically obsessed.
Preferences can be the subject of odd commentary, particularly at election time. You read of parties “giving” their preferences to other parties. But the allocation of preferences by parties was only ever possible in the Senate (and is no longer, thanks to the excellent changes brought in by the government before the 2016 election). There was never a time when it could be done for the House of Representatives, where all a candidate (or party) can do is hand out how-to-vote cards to voters with preference recommendations.
When preferences flowing from minor parties and independents to the majors roughly cancel each other out — as happened in Queensland last year, for example — a commentator might be tempted to declare that preferences “didn’t matter” or “had little effect.” But that would be like announcing, after a soccer match that ended in a five-all draw, that the goals didn’t matter. Preferences nearly always matter at general elections, at least when major-party primary support is low.
And when a talking head pontificates that an election will “come down to preferences,” she is not really saying much, because most general elections come down to preferences — certainly every federal one this side of 1975 — in the sense that different preference flows would have altered the outcome.
Take the big change of government in 2013, for example. If all the 21.1 per cent of voters who put a “1” next to a minor party or independent had then preferenced Labor ahead of the Coalition (rather than the actual 13.1 per cent) Kevin Rudd would have been re-elected with Labor’s biggest majority since the second world war.
Obviously there was never the remotest possibility of that happening.
The “it’ll come down to preferences!” schtick is only meaningful if there’s enough unpredictability about how they’ll flow to alter the overall outcome — for example, how will One Nation preferences be distributed at the next election? — or the parties manage to influence them. In the latter scenario it would make more sense to say that the how-to-vote cards made the difference.
Still, the importance of those cards shouldn’t be overstated. By “little,” I mean that only a minority of voters follow the cards.
It varies by party. Around 5 to 10 per cent of Greens voters seem to follow the cards. That is, in some hypothetical electorate, if Greens how-to-vote cards advocate Labor ahead of the Coalition then Labor might get, say, 85 per cent of them and the Coalition 15 per cent, while if the Greens “preference” the Coalition ahead of Labor the split might be slightly less one-sided, say 80–20, or maybe 75–25, but still in Labor’s favour. So if the Greens vote is 10 per cent, how-to-vote cards can make a difference of 0.5 to 1.0 per cent of the two-candidate-preferred vote, which can of course be crucial in a very close contest.
In practice, it’s extremely rare for the Greens to preference the Coalition, but they usually split tickets, preferencing neither (or both, using both sides of the card) in a few electorates.
The percentage of Coalition and Labor voters who are influenced by how-to-vote cards seems to be much greater, but — at around 35 per cent give or take — it’s still a minority. And because it’s typically a proportion of a larger number (that major party’s primary vote in the electorate), major-party how-to-vote cards can be very powerful — but only in the small number of cases where a major party’s preferences are distributed.
Liberal how-to-vote cards mattered a great deal in the seat of Melbourne in 2010. They preferenced the Greens’ Adam Bandt, and he won; if they’d preferenced Labor’s Cath Bowtell instead it’s almost certain she would have prevailed. (In 2013 and 2016 the Liberals preferenced Labor in Melbourne instead, but Bandt, with the armoury of incumbency, including a very big profile generated in the 2010–13 hung parliament, has easily seen off the challenge.)
Anyway… below are two graphs. The first shows total major-party federal votes, Labor plus Coalition (Liberals plus National/Country Party) since 1946, the first election that the modern-day Libs contested. See the spike in 1975 between the demise of the Democratic Labor Party, or DLP, and the rise of the Australian Democrats.
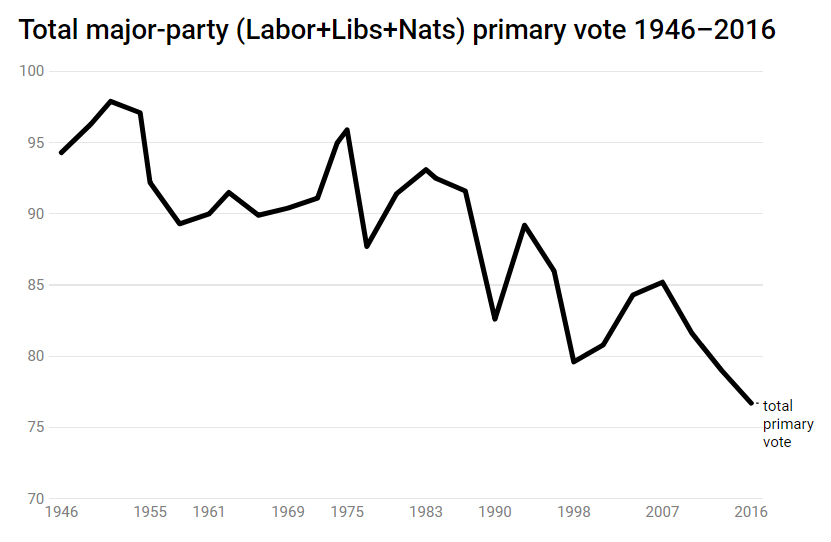
Source: Australian Electoral Commission
The second graph shows the total preference flows to each major party. When the blue line is above the red one, the Coalition is benefiting overall from preferences.
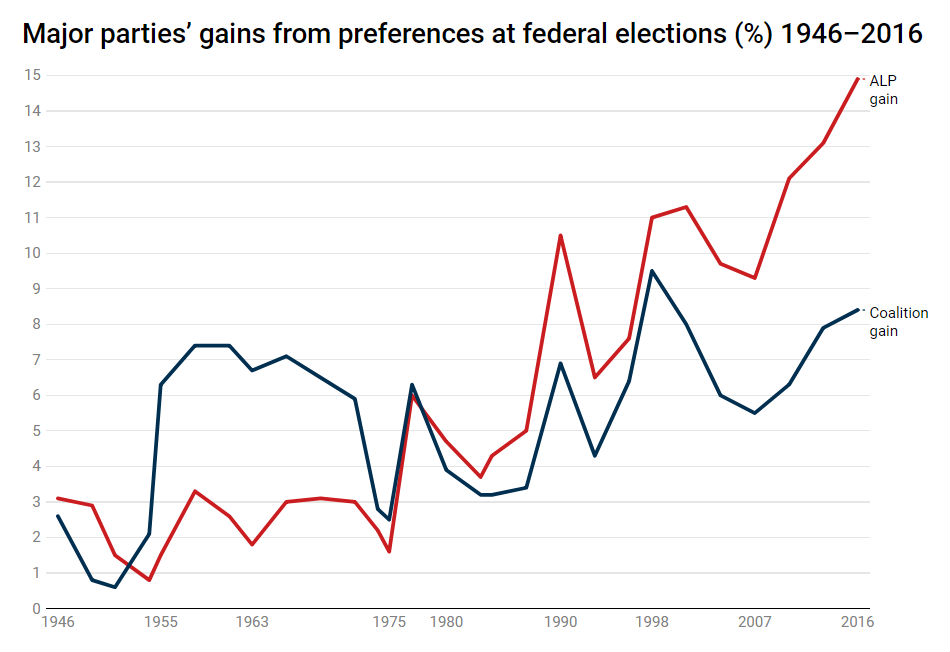
Peter Brent chart using Australian Electoral Commission figures and David Barry’s Australian election statistics.
From the DLP’s arrival in 1955 to 1974, the Coalition benefited more from preferences. Then, in 1977, the centrist Australian Democrats arrived; although they started off as breakaway Liberals their voters soon began to preference Labor more than the Coalition. Again, this had less to do with decisions by that party than the type of people who supported them.
And then the Greens (with voters much more pro-Labor) started doing well, the Democrats imploded and the red line really skyrocketed. It’s not that Labor “relies on Greens preferences”; Greens voters choose whom they preference. It’s more accurate to say that Labor “relies” on compulsory (full) preferential voting, which forces all voters to choose one major party over the other.
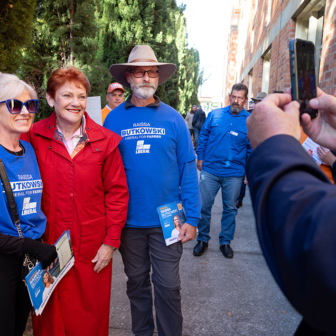
Note that 1998 spurt of the blue line. That was the last election that saw a big vote for One Nation, whose voters (2016 aside) tend to preference the Coalition over Labor.
This segues back to Newspoll preferences… for another day. ●