When a Liberal treasurer tells us he is worried that the low rate of wage growth is slowing the economy, then something is seriously wrong.
In reality, Scott Morrison is probably even more worried about the prospect of a bust in housing prices, which is becoming more likely with each year that passes without action to remove tax breaks for housing investors. That could push Australia into recession.
And he must be worried that someday the house of cards underpinning China’s rapid growth – the even more rapid growth of poorly secured debt – will collapse, and it might happen on his watch. That could push us into recession too.
But in the context of Wednesday’s national accounts, Morrison is dead right. Australians’ real take-home pay is falling. Real household incomes are falling. And unless some X-factor can turn that around, the likelihood of wage growth rebounding and the economy accelerating to the growth rates of old is farfetched.
And that was the key premise of his budget, delivered just a month ago. It projected that average wage growth would double in the next four years to reach 3.75 per cent by 2020. That looked unlikely then. It looks implausible now.
The key figures in the national accounts were those reporting on wages, welfare and household income. Let’s start with that overall income measure.
Household income grew just 2.8 per cent over the year to March – its lowest growth since the last recession. If it doesn’t sound too bad, remind yourself that the 2.8 per cent was being shared by 1.5 per cent more people, at a time when consumer prices rose 2.1 per cent. If household income grows less than 3.6 per cent, then households in general are going backwards. The detail suggests that some or most have lost significant ground.
Those most at risk are those who depend on wages or welfare. Wage growth over the full year to March was just 2 per cent; by the last six months, it was growing at an annualised rate of just 1 per cent. Again, bear in mind that population growth and price growth mean that household wage growth needs to be 3.6 per cent just to keep wage-earning households where they are. The figures tell us that ordinary Australians are becoming poorer.
And the national accounts confirm that, for the first time in many years, government welfare payments are shrinking. Even in current dollars, social welfare payments in the March quarter fell by $1 billion or 3 per cent from a year earlier. The budget papers confirm the fall, and show most of it has been in family benefits.
For comparison: the average growth in household income from 1994 to 2012 was 6.8 per cent a year. For the past five years, it has averaged 3.5 per cent – roughly half its previous level.
Most of that fall has been in growth of wages and salaries. They still make up just over half of all household income, but their share is shrinking fast. Between 1994 and 2012, total wage growth averaged 6.5 per cent a year. But between 2012 and 2017, it has averaged just 3 per cent a year. In the past year it was just 2 per cent.
Those relying on business or investment income are doing better. But in the past six months, even total household income has grown at an annualised rate of just 1.8 per cent. You can’t build a consumer-driven recovery on that.
I confess that this is not what I was expecting; I thought the worst was over, and we were heading back to something like normal. But that is not what is happening.
There are islands of good growth – rising world prices for iron ore and coal meant the mining companies had a bumper year, farmers have had a good year, and professional incomes seem to be immune from whatever else is happening. But too little of this is flowing down to the mainstream of Australians to keep living standards growing.
That is the big story in Wednesday’s national accounts. And it has huge implications for the way this country works.
For the past thirty-five years, Coalition and Labor governments have tried to rein in the power of the trade unions. They have succeeded beyond their wildest dreams. Unions have been decimated, enfeebled, marginalised – and deserted by Australian workers. As a result, management has more power in workplaces than at any time in the last fifty years.
Without unions to amplify their power, ordinary workers’ welfare is a low priority for today’s short-term managers. Mining profits in the March quarter, for example, soared 504 per cent from a year earlier. The average wage of the miners producing that wealth rose 0.6 per cent. One might think we were living in an African dictatorship.
Forty years ago, there was an imbalance of power in favour of trade unions. Governments needed to tackle that, and on both sides, they did.
Today, there is an imbalance of power in favour of management. Governments need to tackle that, as well as the growing imbalance of power that has given the finance sector a disproportionate share of the nation’s wealth.
The March quarter national accounts show where this imbalance of power is taking us. You can see it in the severely stunted wage growth; the low growth in household incomes, especially wages and welfare; the slowing pace of growth in consumer spending (in volume, up 2.4 per cent year on year in the March quarter, or 0.9 per cent per head); and the sharp fall in the household saving rate, which has shrunk by half in the past five years, to just 4.8 per cent of disposable income.
Translation: household incomes are not keeping pace with household costs – especially for families who have taken on big mortgages, or have had family benefits reduced – and people are responding both by reducing their spending and by saving less (or borrowing more).
These trends explain the macro data, which confirms that the economy is basically treading water. Its output (gross domestic product, or GDP) grew by just 1.7 per cent over the year to March, only a smidgeon faster than the growth rate of the population.
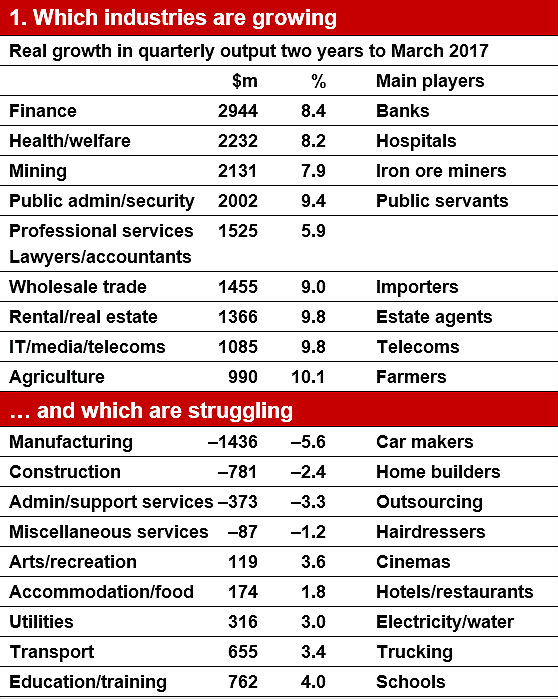
What was generating the growth? By industry, it is surprisingly diverse, as the table below demonstrates. We have seen strong growth in the finance sector, the health sector, mining, the public services, the professions, importing, real estate, telecoms and agriculture. If they represented the entire economy, we’d be booming.
But other sectors are struggling. Take out food and building products, and the rest of Australian manufacturing is in free fall. Over the past two years, its output has shrunk by almost 10 per cent. In the past five years, our output of machinery and equipment has shrunk by a stunning 25 per cent, and that is before the car industry shuts its doors. The reckless policies that caused this deindustrialisation will weaken Australia for years to come.
The construction industry is also shrinking rapidly, partly because mining construction has wound right down, but also because it is now clear that residential construction peaked last year. With the glut of apartments emerging in Melbourne and Brisbane, some apartment towers already approved might not be built for years.
Source: Australian Bureau of Statistics, trend estimates
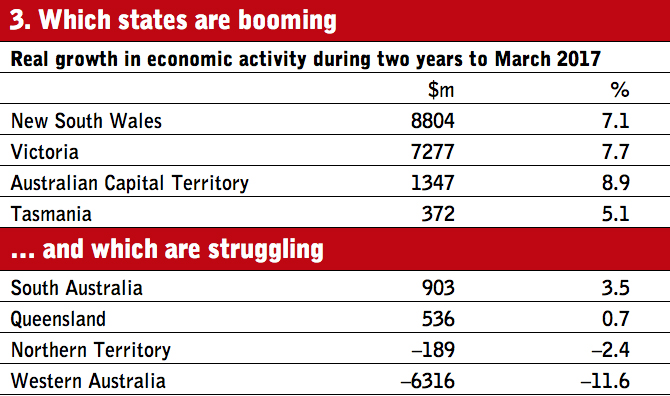
In state terms, the growth pattern has shifted subtly. Western Australia appears to be nearing the end of its long descent, but Queensland has begun a recovery. Activity in New South Wales, the star economy a year ago, has slowed markedly since. Victoria and the ACT are now clearly the strongest-growing economies, with South Australia and Tasmania also picking up pace – and, indeed, outpacing Victoria in growth per head.
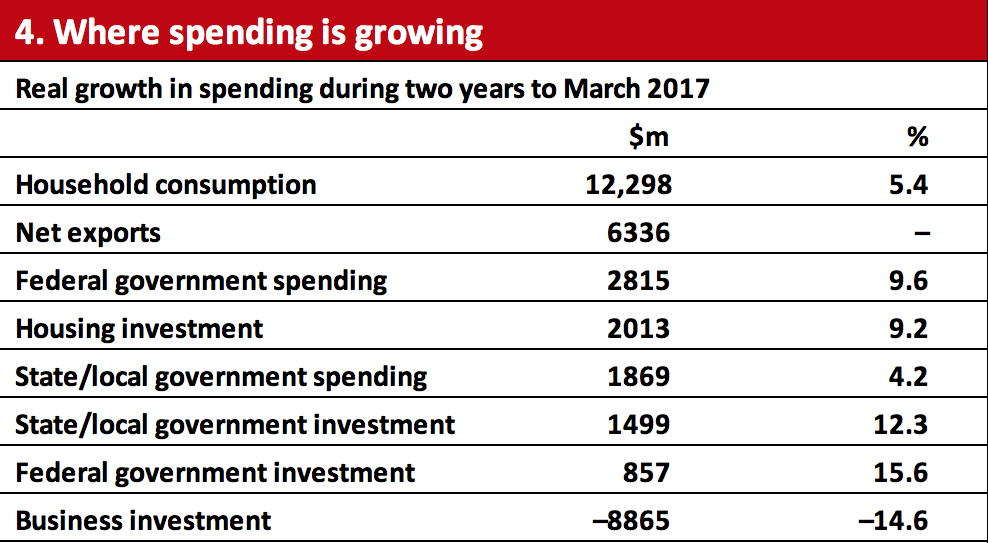
In spending, the dynamo driving growth in the past two years has been foreign spending on our mining exports; unfortunately, mines these days are capital-intensive, foreign-owned operations that employ few workers, and much of the benefit of that growth ends up with foreign shareholders.
Net exports (exports minus imports) generated more than a third of the growth in total spending in the past two years. Federal government spending on its own projects is also booming – because the government has spent any money it has saved – and infrastructure spending too has rebounded from the nadir it reached after two years with Tony Abbott as prime minister.
Yet little of this growth has flowed through to workers – and that’s the problem. Not only are we failing to spread the benefits of growth, but if households are under financial pressure, they will be less likely to spend and invest, which means firms will be less likely to hire and invest, which means economic growth will continue to stagnate.
Even on the smoothed trend figures, wage compensation per employee has fallen by roughly $4 a week since the middle of last year. This reflects the drive by employers to economise on labour costs by replacing full-time jobs with part-time ones. In the year to April, two-thirds of all jobs created were part-time, and total hours worked in the economy grew just 0.6 per cent.
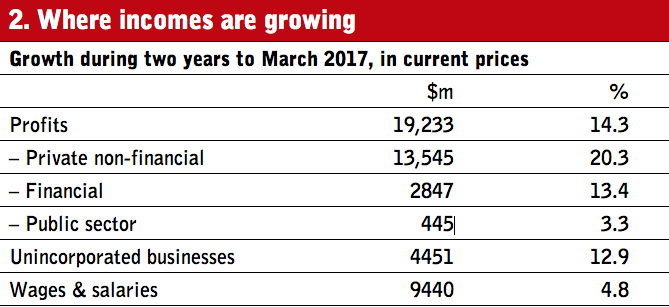
The wages share of national factor income has shrunk to 51.5 per cent, the lowest level since 1964. In the past two years, just 28 per cent of all income growth has gone to wage and salary earners, whereas 49 per cent has gone to corporate profits, and a surprisingly large 13 per cent to unincorporated small businesses. Those are extraordinary figures.
If this were just a passing phenomenon, it would be of minor interest. But if this reflects the way of the future – and as noted, wage growth has been severely depressed for five years – we have a serious problem with income distribution. Our political leaders, on both sides of politics, must acknowledge it, and make reforms to correct it.
It has been exacerbated by the cuts to welfare benefits. The national accounts show quarterly welfare payments to households have shrunk 3 per cent over three quarters. It’s probably not the first time they’ve fallen, but it’s probably the first time they’ve fallen while growth in employment and wage and salary income is so weak.
If you search hard enough, the budget papers confirm this. They project that total welfare payments will fall by $1.63 billion, or 1.25 per cent, in 2016–17, and will grow just 0.4 per cent in 2017–18. The big cut has been in family benefits, which are projected to shrink by $3 billion, or 8.5 per cent, as part of the bipartisan project to turn what was once a universal benefit to parents into a benefit for those on low incomes only.
Student assistance is projected to shrink by $280 million, or 8 per cent, and by much more in future years, but only if the Senate agrees to the government’s higher education changes, which won’t happen. The cuts to family benefits are real. However desirable they may be in helping to fix the budget deficit, they are happening when families can least afford them.
If we’re not prepared to raise taxes to pay for welfare benefits, then it makes sense to cut them; the government still spends $1.09 for every $1 of revenue. But welfare cuts are contributing to the shrivelled growth in household income that has become one of the three key problems facing the economy, along with the house price bubble and China.
After five years of that shrivelled growth, the evidence suggests that Australia is no longer able to ensure that the benefits of growth flow fairly throughout society. Ensuring fairness is now an economic problem as well as a moral one. •
Reference to lowest share of factor income on record corrected to read “since 1964.”