It’s hard to imagine that travellers between Sydney and Melbourne once had to stop at a customs post at the border, or change trains at Albury because each state had a different rail gauge, or suffer the winding two-lane NSW highway until reaching the better road in Victoria. All that has changed, and these days travellers might not even notice they’ve crossed the border – unless they’re parents or teachers of school-age children.
Close to the border on the NSW side is Albury Public School, with its 600 students. Not far over the other side is Wodonga Primary School, enrolling students who are measurably less advantaged, according to the Index of Community Socio-Educational Advantage, or ICSEA. In the world that could have been after the Gonski report was released, each less-advantaged student at Wodonga Primary would have been supported by governments at higher levels than those at Albury Public. But the reality is the reverse. In 2014, the Victorian government funded each student at Wodonga Primary to the tune of $6173. The NSW government provided $8110 for each of its students at Albury Public.
Between 2009 and 2014, the NSW school received an increase in state government recurrent funding of $1373 per student. The Victorian school received less than one-third of that increase from its government. Federal funding added something extra for each school, but the public-funding gap between the two remained unchanged.
NAMING SCHOOLS
This article names specific schools that illustrate serious deficiencies in the way we fund education. Comparisons are mainly made between primary schools, as these tend to be structured in similar ways, regardless of location or sector. Naming schools is not about attributing blame: the schools didn’t create the problems described.
What about other local schools? Albury North Public School is publicly funded, per student, at 26 per cent more than the equally disadvantaged Wodonga West Primary School. Xavier High School, a Catholic school on the NSW side, gets more public funding per student than the more disadvantaged Catholic College in Wodonga. Some non-government schools are funded by governments ahead of similar government schools: Baranduda, near Wodonga, has a Catholic, an Anglican and a government school, all within walking distance, all enrolling similar students. In public funding terms, the government school comes third.
Can similar differences be found across other borders? St Joseph’s College at Banora Point on the far north coast of New South Wales gets more public funding per student than does the very similar St Michael’s College across the border in Queensland. Lindisfarne Anglican School in New South Wales is publicly funded well ahead of two similar independent schools in Queensland. How do the two Queanbeyan primary schools (Queanbeyan Public and Queanbeyan West Public) compare with similar schools in the Australian Capital Territory? Successive federal ministers might know; they have long used Queanbeyan schools as backdrops for the announcement of new policies. Nine schools with similar students in the ACT receive, on average, 30 per cent more in public funding than the two primary schools on the NSW side.
There is nothing unusual about these schools near state borders – it’s just that their proximity to each other means the contrasts are more easily noticed. Any national sample shows similar problems. There are, for example, forty-eight medium-size metropolitan primary schools in Australia with an ICSEA value between 1000 and 1009. It is a small sample, but the schools are all very similar in terms of their educational challenges. Among the government schools, the highest-funded dozen average $12,300 per student, 43 per cent more than the lowest-funded dozen at $8566. Eight of the thirteen Catholic schools receive more public funding than the lowest-funded half dozen government schools.
Almost all of these schools have at least one thing in common: the differences in the way they are supported by governments make little educational sense.
How much money is enough?
There’s no shortage of commentary about how much funding is needed to lift student achievement – along with assertions that current levels aren’t doing it. Our expenditure on schools is substantial, but it is not effectively linked to goals and is poorly directed, with little coordination between levels of government.
The problem is about much more than dollars. The way we resource our schools doesn’t sufficiently reflect the task faced by each school in improving the achievement of its students – and the future prospects of the whole nation. Despite all the apparent commitment to funding schools on the basis of need, we are not doing that in any systematic way. We aren’t focusing on the schools where the money will make the greatest difference. Indeed, much school funding goes to schools whose students are already advantaged, where the additional funding certainly makes very little difference.
If were serious about funding schools according to their needs, the dollar figures for schools such as these would look quite different. To put this to the test, we have applied to the schools mentioned above a funding formula based on components of need, including school type, enrolment, location, and the proportion of students in known disadvantaged groups and in the lowest two quarters of the ICSEA. All the required data comes from the My School website.
The figures for the likely needs-based funding level, along with the amounts above or below existing levels, are shown in the final two columns of this table. What matters is not so much the dollar amounts but the relative difference, for each school, between the needs-based projections and the actual funding levels.
Likely needs-based funding for selected Albury–Wodonga schools, 2014.
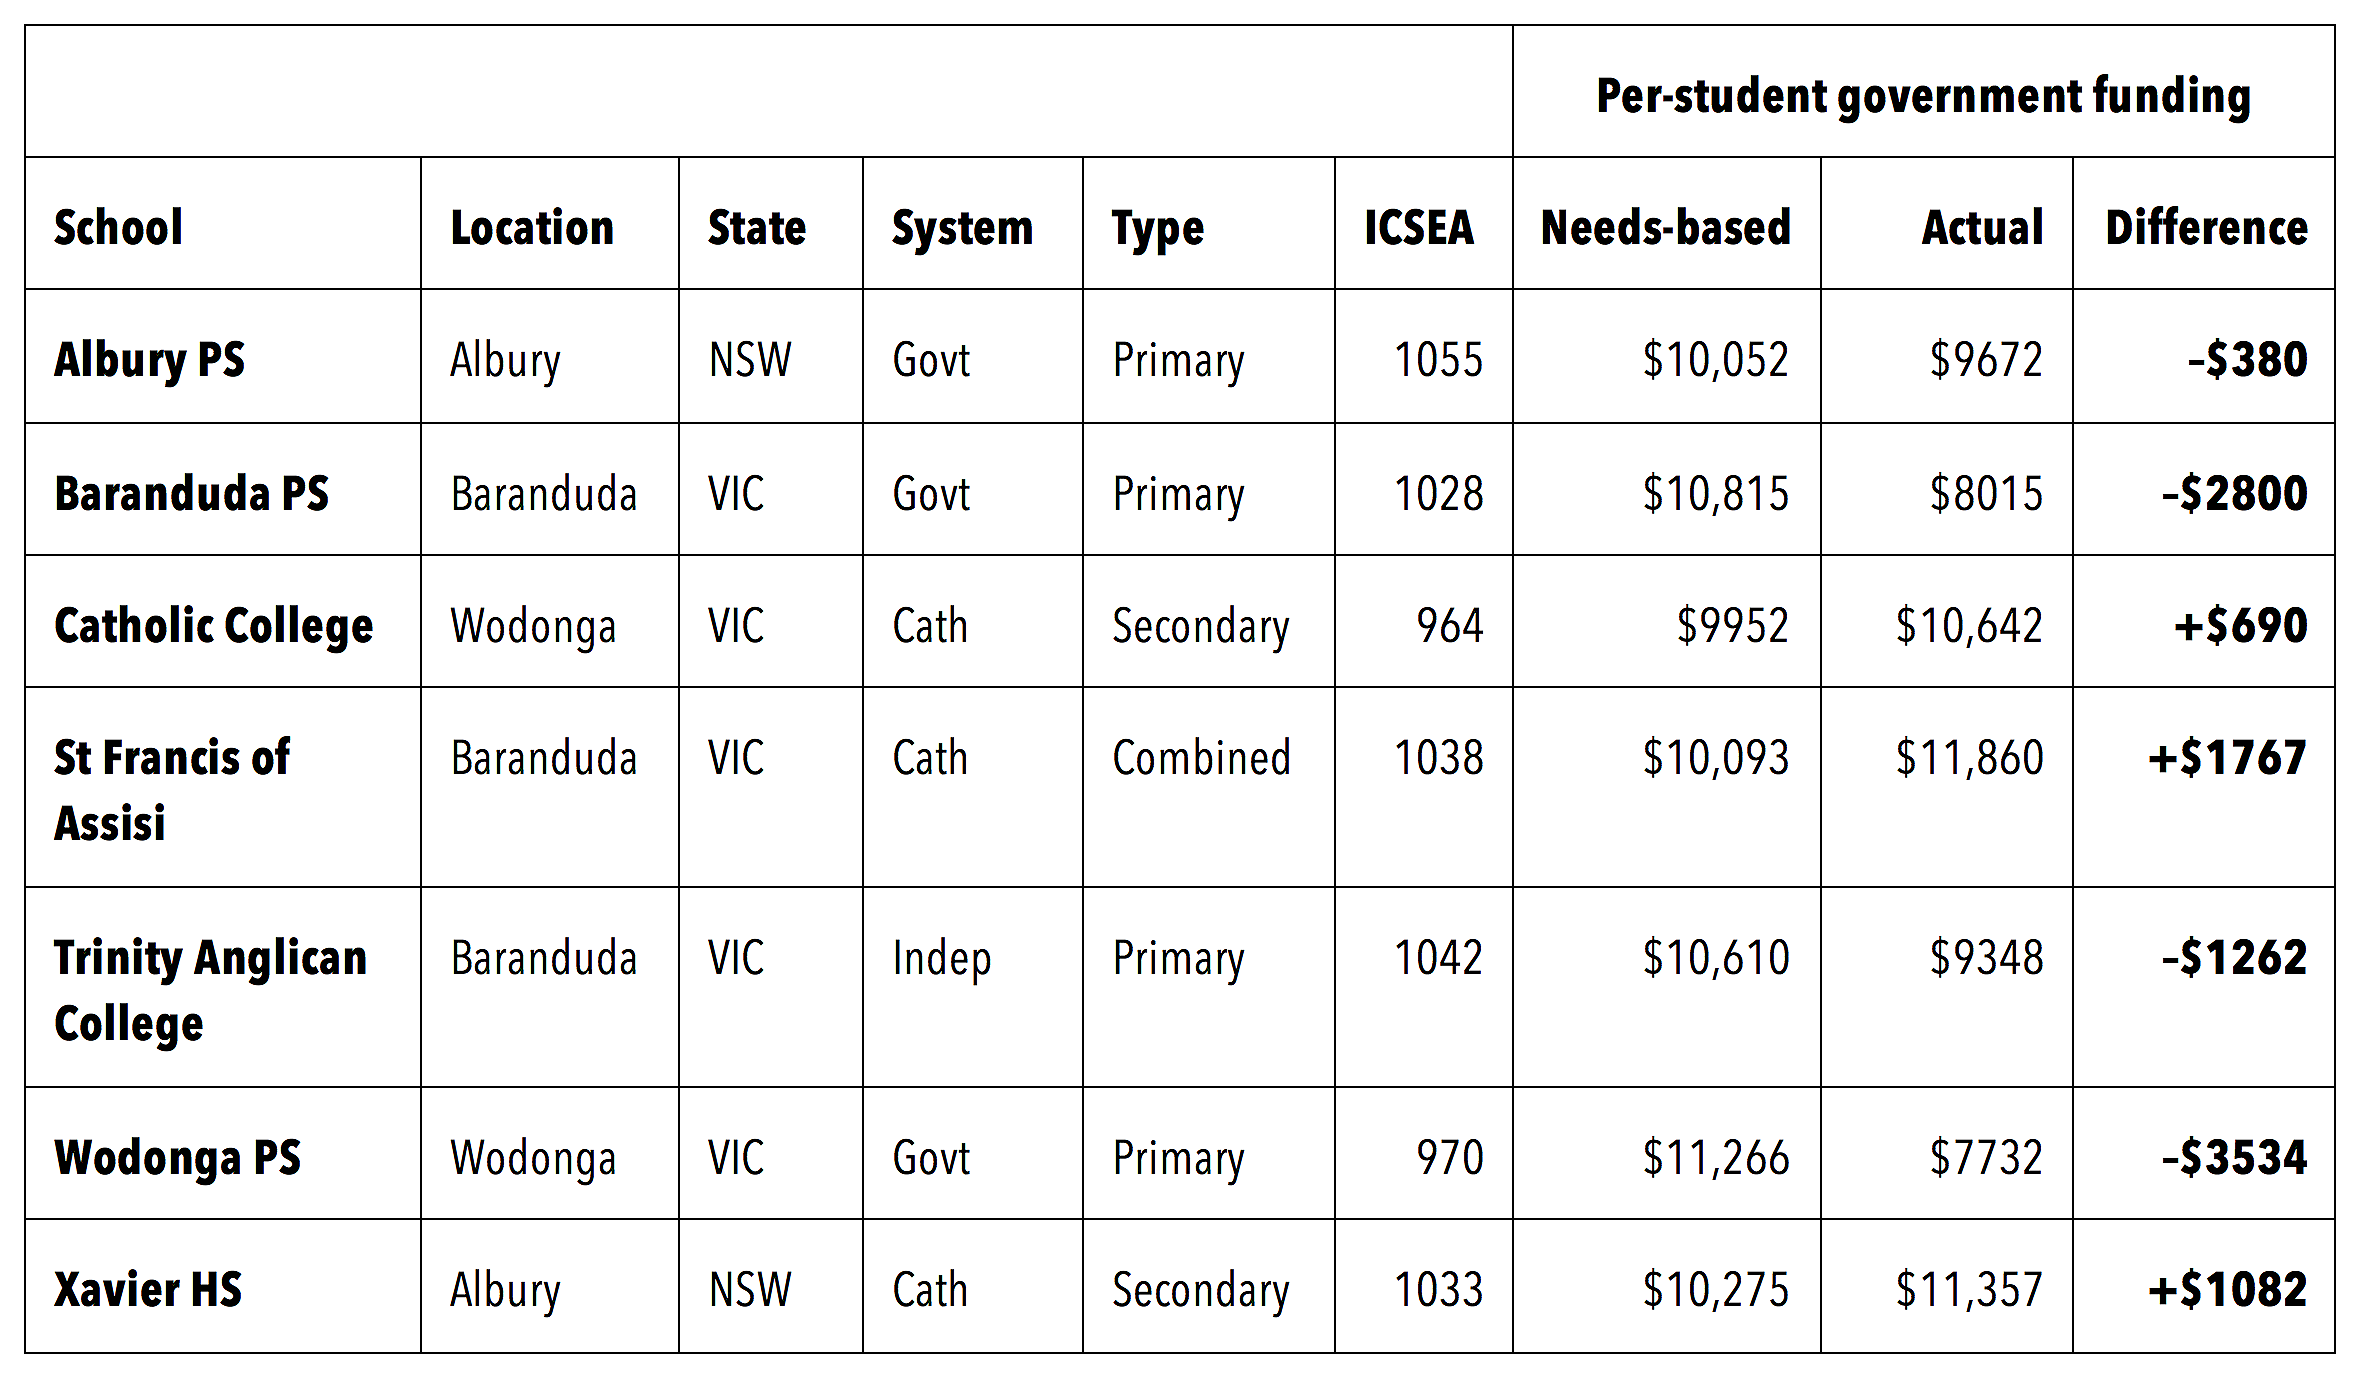
Our needs-based calculations show that a number of schools might be entitled to higher per-student funding than they currently receive, while others might be entitled to less. The less advantaged Wodonga Primary, for instance, would receive more per student than Albury (although on these numbers, students at both schools would actually receive more). Using needs-based funding, the three Baranduda schools would be funded in closer relationship to their ICSEA values than is currently the case.
These figures were calculated using the funding formula embedded in the Australian Education Act 2013 – the closest the Gillard government got to implementing the Gonski recommendations. We have used a My School proxy field for the English proficiency loading in the Act, though this is a relatively minor factor for the schools mentioned above. The My School data doesn’t contain another of Gonski’s needs categories, the percentage of students with a disability, for which we haven’t been able to compensate.
In relative terms, our needs-based figures approximate the amounts that would have been calculated for those schools under the 2013 Act. They show what a different distribution of funds might look like, rather than laying down definitive amounts for each school, and better reflect the task faced by each school in improving student outcomes.
None of this denies the importance of investing in specific, high-quality programs in schools; implementing evidence-driven reforms; improving the capacity of teachers and school leaders; and ensuring authentic and properly resourced school accountability. None of that goes away. What would largely go away, or at least substantially decrease, is the large element of chance in how we currently fund schools.
The chances we lost
What did Gonski want? The review recommended that the resource level for each school should be expressed as a school resourcing standard, or SRS, set at a level at which it has been shown – in schools with minimal levels of educational disadvantage – that high performance is achievable over time. As Gonski panellist Ken Boston reminds us:
We took as our benchmark those schools in which at least 80 per cent of students were above national minimum standard for their year level in reading and numeracy in the most recent three years. This was highly aspirational: it was, and still is, about 16 per cent of schools. We saw the SRS not as a funding mechanism, but as the “price” that had to be paid to bring all schools to standard.
To that end, the panel recommended for all schools a system of funding based upon a fixed, evidence-based amount for each primary or secondary student – the SRS – plus additional amounts for various elements of need (“loadings”).
We proposed a change from a funding allocation system that for forty years has been top-down, politically driven, sector-based and needs-blind, to one that is built from the bottom up, educationally-driven, sector-blind and needs-based.
Gonski and his colleagues recommended that funding consistency and equity across Australia should be driven by a National Schools Resourcing Body, jointly owned by all governments. It didn’t happen. Separate funding deals were done with the states and non-government sectors, and we were left with what we’ve had for decades: school funding that’s still essentially a political settlement, sector-based and needs-blind. New South Wales has proven to be an exception, as Boston describes, demonstrating the feasibility of building school funding from the bottom up as envisaged by Gonski.
The heated discussions about school funding have rarely touched on the local impacts of this negligence. It isn’t a remote problem; it plays out in the schools we see each and every day. It’s easiest to see on the state borders, where schools that are treated differently are so close to each other. But all schools are affected: we now have vastly different levels of provision for students, a provision based on the state, sector and community in which they are located – and the families into which they are born.
States of chaos
We’ve seen what school funding looks like on the ground and how it could be different.What does the broader picture reveal, especially about our two levels of government?
For a variety of reasons, the federal government has become a large source of school funding. Between 2009 and 2014, its recurrent funding expenditure on all schools increased by 34.5 per cent, around three times the percentage increase in state and territory expenditure per student. Federal education minister Simon Birmingham is right to complain about the states not pulling their weight – even if they are responding, in part, to mixed messages from his government.
In one respect there is consistency in federal government funding: it is consistently biased towards non-government schools and has consistently responded to pressure from that sector. As former senior education official Jim McMorrow observes, the Turnbull government has decided to index grants annually by 3.56 per cent after 2017, and will include school fees as a direct measure of inflation.
If lack of logic and consistency is an indication of policy failure, then the funding of schools by state and territory governments ticks all the boxes. Some state funding of government schools, for example in New South Wales, rose between 2009 and 2014; in other states, the pattern resembles a roller-coaster track. Meanwhile, state government funding of non-government schools rose almost everywhere, especially in both Victoria and Western Australia, where it increased at four times the rate of increases to government schools. If the states are run – as one federal minister asserted – by “adult” governments, then they have certainly neglected most of their own children.
It is hard to believe that the government schools in Albury and Wodonga, Queanbeyan and the Australian Capital Territory, and on either side of the NSW–Queensland border exist in the same country. And these aren’t the most extreme examples. The ACT, for instance, provides 50 per cent more public funding to its public schools than does Victoria. Is anyone casting an eye across Australia and between sectors to see if the system is fair and consistent, and reflects any considered and agreed rationale?
Accumulating problems
The shift in government funding priorities and directions over the past few years, measurable using My School data, has both exposed and worsened a raft of other problems. We expand on these in two recent reports, School Daze: What My School Really Says about Our Schools and Uneven Playing Field: The State of Australia’s Schools, published by the Centre for Policy Development.
The relative neglect of low ICSEA schools: Under the Gonski recommendations, the investment in these schools would have risen considerably. But public funding for low and high ICSEA schools has actually increased at much the same rate.Recurrent government funding for public schools, which enrol students with the greatest needs, has increased at just half the rate of increases to the non-government sector.
Rising inequity: The educational outcomes of schools should be created by the things schools do, by the effort and expertise of teachers and by school leadership – all supported by the right policies. But recent outcomes are increasingly the result, in the well-known words of the Gonski review, of “differences in wealth, income, power or possessions.” Inequity is rising.
Enrolment shifts that highlight a divide: There is aslow but consistent movement of students out of lower, and into higher, ICSEA schools. The students who are moving tend to be more advantaged than the ones they leave behind. This compounds disadvantage in low ICSEA schools, a problem that was strongly emphasised in Gonski’s findings.
Diverging student achievement: Much is written about trends in our NAPLAN results, which are currently reported to be plateauing. But student achievement in high and low ICSEA schools has consistently diverged over six years and this trend will almost certainly continue. That goes a long way to explaining our drift.
Poor allocation of apparently scarce funding: We overinvest, in both public and private schools, in students who are already advantaged, without any improvement in student outcomes. Meanwhile, these high levels of investment would make a considerable difference in less-advantaged schools in all sectors.
The gap between schools and their local community: For two-thirds of Australia’s schools, the local community is increasingly not the community of the local school. Both push and pull factors have driven students to more distant schools. Schools are increasingly detached from, and less representative of, their local communities.
The vanishing “non-government” school: Government funding to private schools has increased to the point where it is meeting and sometimes exceeding the funding going to public schools with similar ICSEA ratings. The public funding of the two sectors is now at odds with the reality that one is a public system and the other, in a legal and technical sense, is privately owned and operated, and has significantly different accountabilities and obligations.
The mounting costs of inequity and disadvantage: The costs of failing to close the gaps are increasingly well-known and increasing. Young people who are not fully engaged in education or employment (or a combination of both) are at greater risk of unemployment, and of low pay and insecure employment.
What all these developments have in common is not that they are new, but that they have worsened since 2009 in ways that can now be measured. And the evidence is compelling and mounting. More important, most are developments that would be having much less of a negative impact if Gonski’s recommendations had been implemented.
THE VANISHING “NON-GOVERNMENT” SCHOOL
A pressing problem challenges our very framework of schools. Governments fund two quite different sectors: the public, or government, sector is fully funded; and the private, or non-government, sector is almost fully funded. In terms of funding, “public” and “private” are becoming meaningless.
The extent of public funding is buried behind commonly touted average funding figures for each sector. Federal education minister Simon Birmingham tells us that private schools get just 60 per cent of the public funding going to government schools. But Xavier High School gets almost 95 per cent, not 60 per cent, of the public funding going to the quite similar Albury High School. In the far north of NSW, St James’ Primary School and St Joseph’s Primary school each get not 60 per cent, but around 106 per cent, of the public funding that goes to the otherwise similar Kingscliff and Terranora Public Schools.
The bigger picture emerges when we compare the funding of large numbers of schools that enrol students with similar educational needs. Most Australian schools fall into the 950–1150 ICSEA range. In this ICSEA range, governments fund Catholic schools at between 90.8 per cent and 99.5 per cent of the dollars going to public schools. The figures for Independent schools range from 79.5 per cent to 94.6 per cent. Catholic schools in Queensland in this range get 89.0 per cent of government school public funding, NSW schools 93.1 per cent and Victorian schools 104.8 per cent. The corresponding figures for Independent schools are Queensland 78.3 per cent, NSW 84.0 per cent and Victoria 91.5 per cent.
Average funding figures don’t tell this story because the sectors are quite different. The sector that must be available to every child from every family in every place and circumstance inevitably enrols students with higher needs and hence faces higher costs. Comparing average funding across whole sectors creates yet another half-truth. Whether it be student achievement or school funding, My School enables us to compare schools enrolling similar students.
Why should any of this matter?
On 23 September, the COAG Education Council, made up of the nation’s education ministers, will meet once again to coordinate strategic policy on school education and to collaboratively address issues of national significance. Or that is what its website says.
It is highly unlikely that the ministers will make any serious attempt to inject logic, transparency and efficacy into the way schools are funded, especially to ensure that the greatest support consistently goes to the students and schools with the greatest need. They will also avoid dealing with a potential crisis that may emerge from the burgeoning public funding of non-government schools – with all that this means for those schools’ identity and obligations, and the nature of their relationship with public schools.
It is possible that the ministers will walk out of the room trumpeting the same patch-ups we have seen in the past. The trumpeting that won’t be heeded will come from the elephants in the room.
Perhaps the escalating consequences of the failure to implement Gonski aren’t “national” enough or don’t warrant a “strategic policy.” After all, there have always been differences between the way different states provide and fund various services. Why put school education on a pedestal for greater consistency?
There are three good reasons why. First, education is an essential foundation for personal livelihood, civic and social life, and economic growth. More than ever, we need assurance that our investment is properly targeted. The unequal distribution of resources to students and schools on the basis of accidents of geography seems, at best, a quaint hangover from the nineteenth century.
Second, education has assumed much greater national significance. The federal government is now active in over three dozen school programs, from A (agriculture) to almost Z (vocational pathways). It sets standards and mandates, provides resources and creates policy initiatives, and it pulls just about every policy lever available to it. Time for it to show leadership where it really matters.
Third, education funding is a mess, and it’s everyone’s mess. Gonski described school funding as complex, confusing, opaque and inconsistent among jurisdictions. He was probably being nice. The panel recommended that governments join forces to make sure that resources go to where they were most needed. Back then it was too hard. It is now even harder, but much more urgent.
If all schools had similar obligations and accountabilities, the convergence of public funding might not matter. But they don’t. One sector is required to be available to all students from all families in all locations and circumstances. The other has no such obligation. Differences in requirements for legislative compliance, staff recruitment and school reporting; student enrolment discriminators; student management practices – all these make little sense when when public funding to most schools in each sector is not too different.
Where to now?
The effective withdrawal of the federal government from Gonski funding, combined with the lack of agreed funding priorities and coordination means that current problems won’t be dealt with for years. Indexing a reduced commitment will ensure that current arrangements will last well beyond the terms of the governments sitting around the COAG table. In the longer term, the deficits created by the way we provide and resource schools will continue to accumulate. The costs of repair in the future will dwarf Gonski’s price tag.
We might get to the point where our institutionalised farce will become too great to ignore. Perhaps it will be when the parents at Wodonga Primary School, having looked across the border, hammer on the door of the Victorian government. When the teachers at one non-government school compare their balance sheet with that of another. When the principal at the public school asks out loud why its rules and obligations shouldn’t apply to the publicly funded non-government school down the road. When voters demand that the money spent on schools be used to target need and hence lift overall achievement. When governments join the dots and join forces to create something better. So far, there’sno sign on the horizon. •
Several figures have been adjusted to correct an averaging error in the second paragraph under the subheading, The Vanishing “Non-Government” School. The changes do not affect the article’s overall argument.