In the world of school education we seem to lurch from one media-driven panic to another. Some sensational reporting seems to arise out of not much at all; in other cases it’s built into the cycle of the school year. This month’s release of Australia’s annual NAPLAN scorecard is in the latter category, an event so predictable that media outlets could plan their eye-catching headlines and stories of failing schools well in advance.
No matter that the better-informed commentators often contradict the panicky reporting — as Sally Larsen from the University of New England did this time around when she pointed out there has been no decline in NAPLAN results since 2008. Once again, it was much ado about not much.
But NAPLAN and other data are revealing a trend we really should be worried about, yet has had barely any coverage at all. We want to believe that what teachers and schools actually do is critical to student achievement. After all, that is what they are paid for. But the figures show that differences in student outcomes are increasingly explained by the social background of families and schools.
The irony is that the evidence of this problem comes from the same source — the My School website — that publishes the test scores that generate the sensational headlines. My School was launched years ago with the promise that it would make schools more accountable and easier to compare. Critics see it as a very visible artifact of a failed neoliberal experiment to force schools into competition with each other and, we were told, lift overall results. Instead, what we are left with is a status ladder of schools, largely created by who they enrol.
My School gives a figure, known as ICSEA, that indicates each school’s socioeducational advantage as well as their NAPLAN scores. Is there a relationship between ICSEA and NAPLAN? Absolutely. My School makes it possible to see how schools in a given community form a loose hierarchy, with the schools displaying the highest socioeducational index usually churning out the highest NAPLAN scores.
How do we know this is happening? The statistical relationship between ICSEA and NAPLAN tells the story. For any group of schools — down to a selected sector in a given location — average NAPLAN scores can be combined with ICSEA figures to generate a scatter graph. The pattern formed by the dots, summarised in a trend line, invariably shows that the schools with high ICSEA values also have high NAPLAN scores.
The angle of the trend line, expressed as a percentage, shows the strength of this relationship, described as an equity slope. Higher percentages, representing a steeper slope, indicate a closer relationship between ICSEA and NAPLAN — and therefore less equity. Lower percentages indicate greater equity: social advantage (and everything that comes with it) may not be as big an influence, and what schools are doing is having a more significant impact.
Here are a couple of large-scale examples, for Australia as a whole and for the Northern Territory:
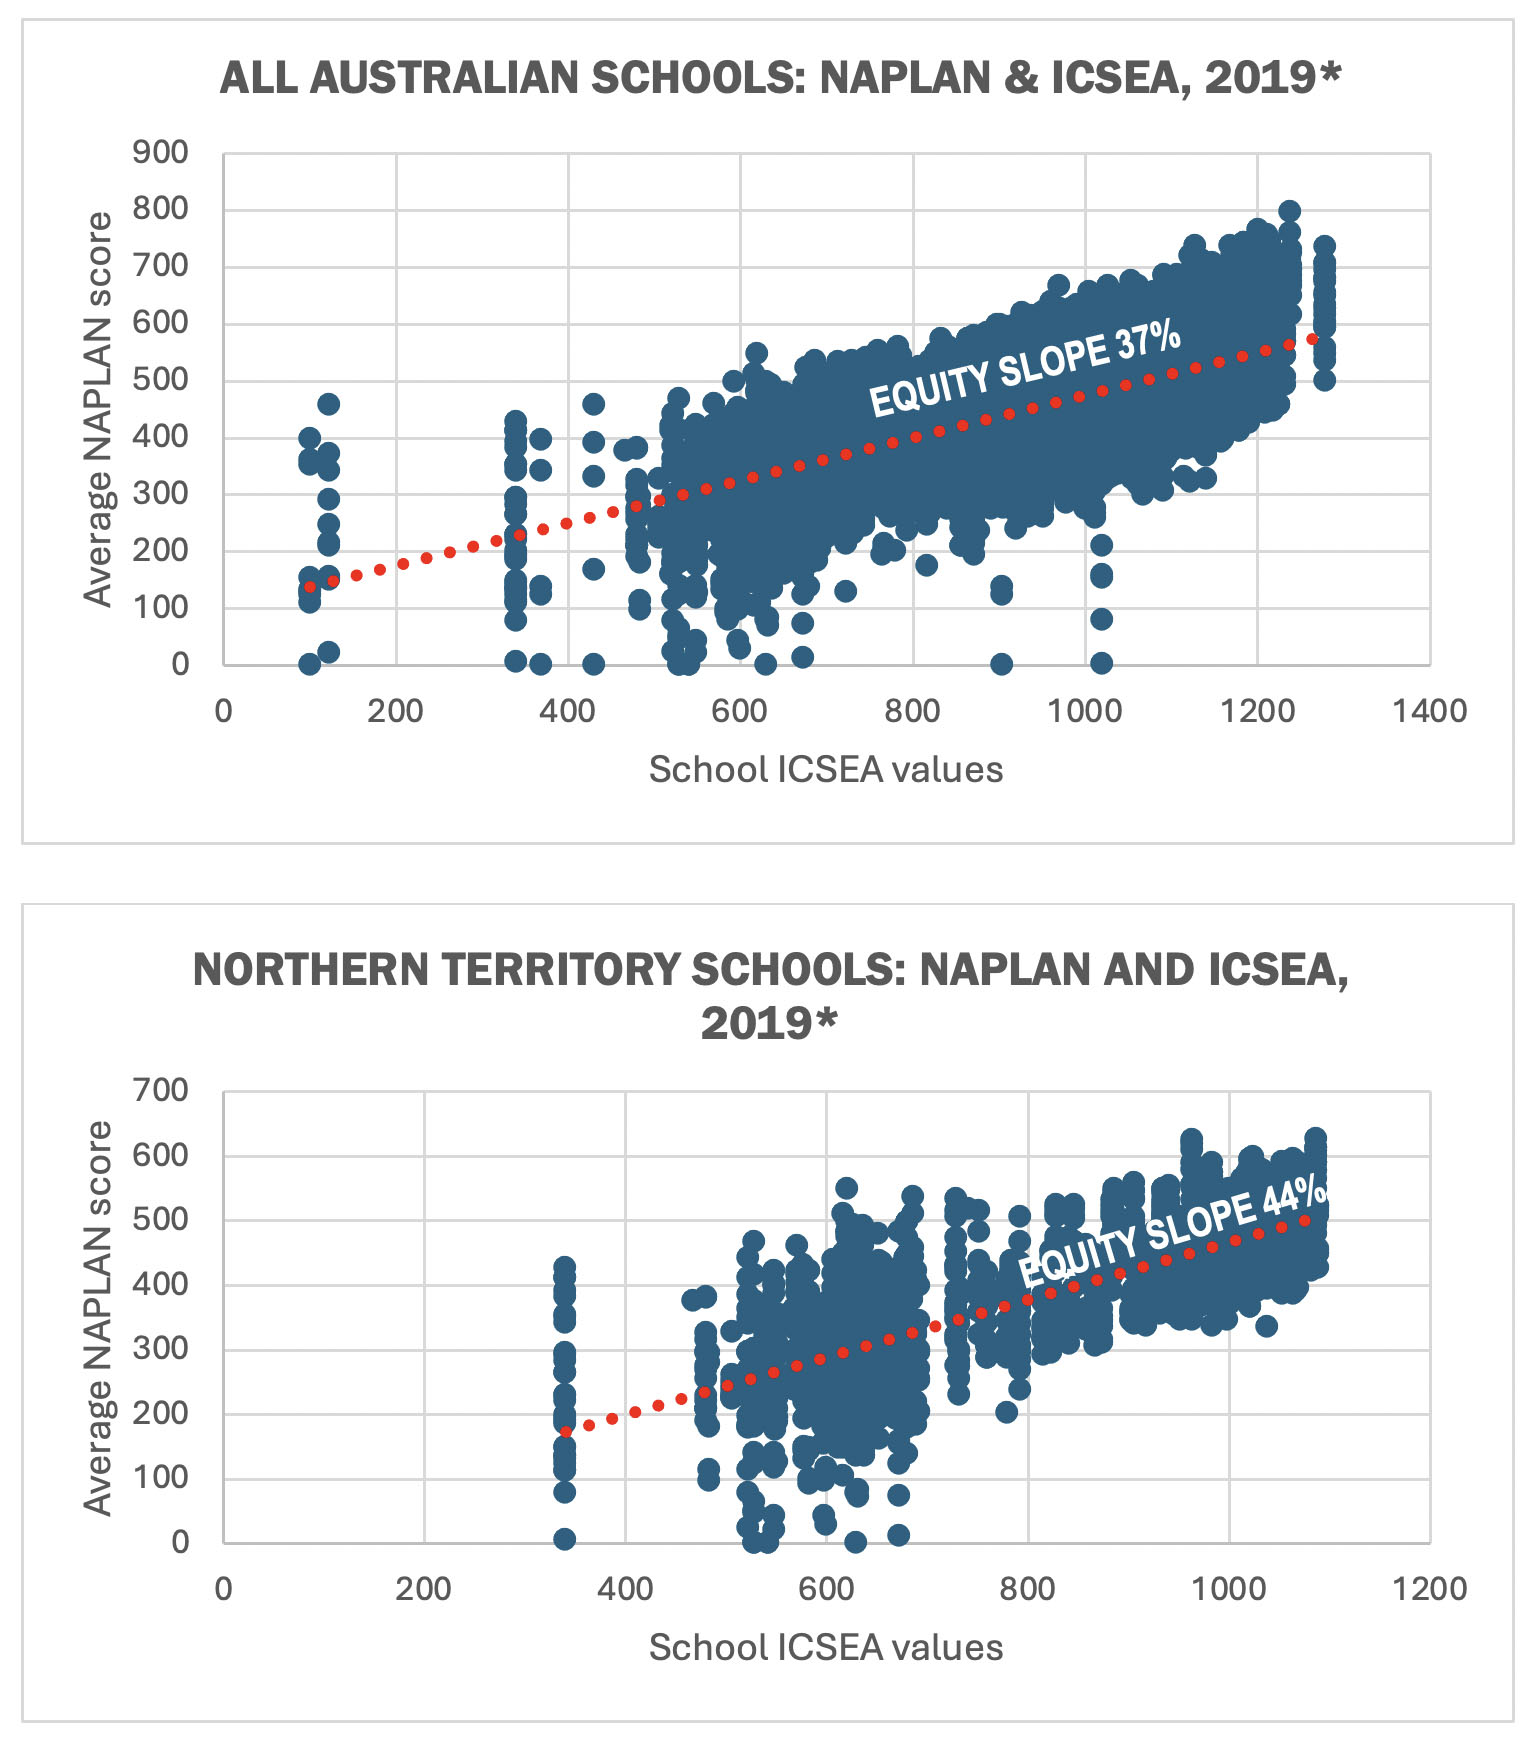
Even more important than snapshots like these is how the slopes change over time. Back in 2012 quite a few groups of schools had an equity slope in the 20 to 30 per cent range. Now most are in the 30s and even the 40s. (Remember, high numbers mean poor equity.) The change has been pretty consistent, and in some cases dramatic.
Equity slopes vary from place to place and even between school sectors. This is well illustrated by the ICSEA ranking of schools. Most schools are on the middle rungs of the ranking, where the equity slopes are now close to the Australian average of 37 per cent, up from 33 per cent in 2012. On the bottom rungs, the slopes are steepening (or worsening), possibly because these schools take in many more of the most disadvantaged kids.
The most interesting group are those on the top of the ladder: the schools to which families often aspire. They might be good schools by some measures, but over the decades they have shaped their success by selecting who they enrol, something that even schools down the ladder have tried to emulate. These schools run the show: if you want to do well, they say, you need to look like us.
So here’s the biggest shock: it is these schools, the ones oozing success, where equity is worsening most rapidly. The equity slope of Australia’s schools above ICSEA 1100 (well beyond the 1000 average) rocketed from 37 per cent to 56 per cent between 2012 and 2019. Perhaps their 10,000 teachers are having less of an impact on student achievement than we are led to believe. In New South Wales, where there is an affinity of sorts between high-end private schools and almost fifty selective public schools, the slope shifted from 39 per cent to 64 per cent. “Elite” schools are making a difference, but not the one we expect.
The surprises keep coming. In New South Wales the equity slopes in the three school sectors — government, Catholic and independent — are almost as bad as each other, especially in the major cities. Outside the cities the public schools have a much lower (better) equity slope. Despite having more of the strugglers, public school teachers in the bush seem to be more successfully lifting the achievement of their commonly marginalised students.
Among other revelations, school equity seems to worsen between Year 3 and Year 9, perhaps because enrolment segregation between schools is greater at the secondary school level. The slopes seem steepest for reading and largely unchanged for writing, perhaps because reading is more likely to begin in the home, while writing is more a school thing.
Of course, school achievement is subject to many influences; any educator could come up with a list. And measures of anything can be less than perfect. But our equity slopes have been steepening, and this suggests that inequity is now baked into our framework of schools. It also suggests that nothing short of the changes recommended late last year by the federal government’s expert panel on Improving Outcomes for All will suffice.
The panel found that “concentrations of disadvantage not only undermine the capacity of schools to build diverse communities of future citizens but also lead to poorer learning outcomes for students experiencing disadvantage.” It recommended that “governments, school systems and approved authorities commit to increasing socioeconomic diversity by reviewing existing policy settings by the end of 2027 and implementing new policy levers to increase socioeconomic diversity in schools and lift student outcomes.” Progress should be tracked and reported on annually, says the panel.
Those welcome recommendations seem to have been buried in the ongoing fracas over school funding, but at the very least they should be embedded in current plans, especially the new federal–state Better and Fairer Schools Agreement. If that doesn’t happen to the extent needed, the next ten years will be like the last fifteen.
We know that the best-performing school systems are usually the most equitable, and we know that governments in Australia routinely trumpet their equity goals. But they’ll never achieve those goals until they identify and deal with the fundamental features of school education that get in the way. •