Australia’s latest economic report card from the Bureau of Statistics surprised everyone. We were expecting it to report that growth was slowing. Instead, it says growth is accelerating — indeed, as new Treasurer Josh Frydenberg noted, we are growing faster now than at any time since the mining boom peaked in 2012.
The country’s total output of goods and services — gross domestic product, or GDP — swelled by 3.4 per cent over the twelve months to June. Indeed, on the seasonally adjusted figures used by most analysts, the economy grew at a stunning annualised rate of 4.1 per cent in the first half of 2018.
Moreover, as Frydenberg pointed out, while business investment made no contribution to growth, “the strength in the June quarter was broadly based. Household consumption, dwelling investment, new public final demand” — that’s government spending — “and net exports all contributed to growth in the quarter.”
Household consumption? Dwelling investment? That’s us! Aren’t we meant to be victims, squeezed between low wage growth, high debt and rising prices? Yet we’re spending up big, and because of us, the economy is booming?
Why doesn’t it feel like that? What have we failed to see?
At face value, if Australia really is growing at this pace then the Reserve Bank ought to be seriously considering raising interest rates, to repair some of the damage it did to housing affordability by its misguided rate cuts in 2016.
But it would need to think carefully. For another explanation of these Goldilocks figures is that this snapshot captures the lucky country at a lucky moment: just before the waves break, and the swells that have surged up in the past couple of years recede, leaving the economy flat — and maybe experiencing a heavy undertow.
In their way, the national accounts only confirm the economy’s core weaknesses: stagnant wages, widespread underemployment, unaffordable housing (at least in Sydney and Melbourne) and a dangerous reliance on borrowing to make reality meet our aspirations.
Let’s look at how we grew so fast, and whether that is sustainable, via ten takes on the data in the national accounts:
1. Our population is booming. The accounts imply that in the year to June, our population grew by just under 400,000, up more than 1.6 per cent. That’s not an official population estimate — they take months to finalise — but it incorporates information that the Bureau knows and we don’t. It implies that in the first half of 2018, when we thought population growth was slowing, it accelerated at its fastest pace in the five years since the mining boom peaked in 2012. Our population probably passed twenty-five million in the first week of July, not in August, when we celebrated it.
In all, almost half of our 3.4 per cent growth in output can be attributed to population growth. Per capita GDP grew by 1.77 per cent: that was also its strongest growth since the mining boom, but still below the 1.9 per cent that was our long-term average before the global financial crisis. And sorry Josh, it doesn’t outpace growth in all G7 countries: per capita, the deficit-driven United States has raced past us.
2. Victoria is setting the pace, Western Australia sliding back. Partly because of its population growth, Victoria had by far the fastest growth in economic activity of any state in the year to June. Its total spending (state final demand) grew by 5.2 per cent, and by 2.9 per cent in per capita terms. By June, Victoria was the only state in which government infrastructure spending was still growing. But Western Australia went backwards in the first half of 2018, as mining investment continued to wind down.
3. Nothing is seriously holding us back. Usually the economy is running into some headwind that slows its pace, as the end of the mining boom has been doing ever since 2012. The accounts show there are plenty of problem areas — slow wage growth, slowing infrastructure spending, the end of the housing boom, Western Australia, flat business investment and the drought — which could combine to make 2018–19 a year of slower growth. But in the first half of 2018, the economy was in a sweet spot, with those headwinds outmuscled by the tailwinds blowing us on.
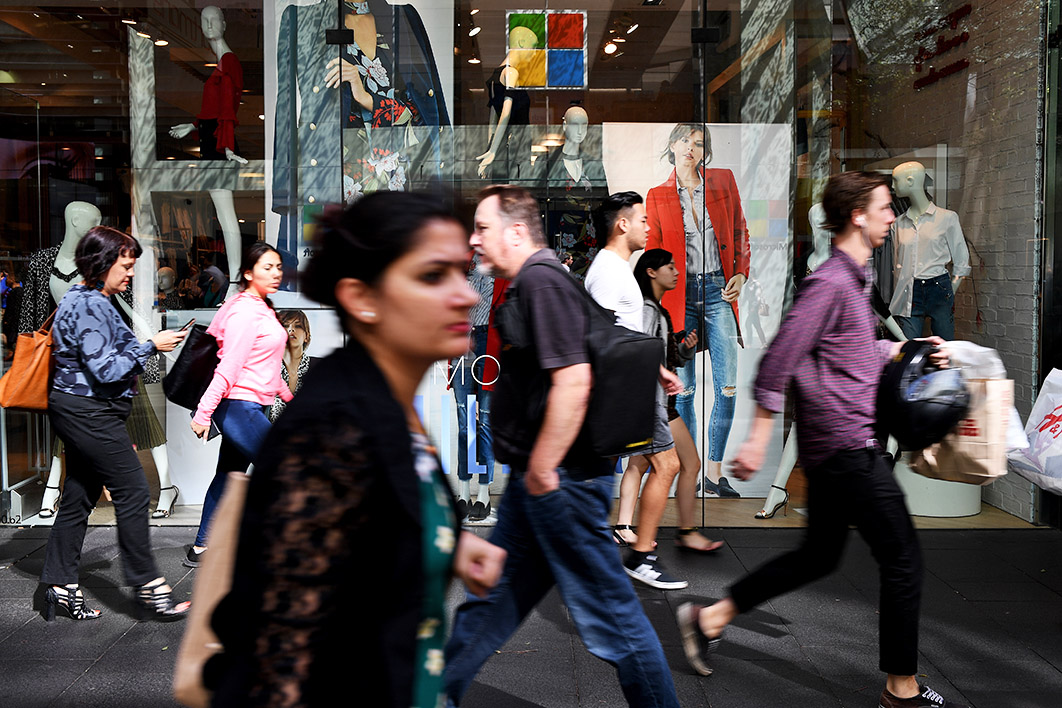
4. Consumers are spending more and saving less. Households are collectively the biggest spenders, and with the population growing fast, their total spending is growing fast. Over the year to June, consumer spending grew by 3.1 per cent on the trend measure, providing more than half the growth in total activity.
While part of that went on necessities like rent, mortgage payments, food and healthcare, the single biggest increase was in spending on entertainment. And the fastest growth was in spending on clothing and footwear, followed by spending on mobile phones, entertainment, household equipment and transport.
This doesn’t sound like households are burdened down by low wage growth and rising prices. But we were spending more because we were saving less.
The Bureau estimates that households saved just 1.1 per cent of their disposable income in the June quarter — a sharp fall from 3.6 per cent two years earlier, let alone from the average of 6.7 per cent over the first seven years after the global financial crisis. Saving can’t continue to fall without creating much bigger problems than slow economic growth.
An important caveat, however. The Bureau calculates savings as what’s left after it’s estimated everything else. That means the savings figure tends to be revised as better data comes in, and sometimes it’s been revised up a lot. It could be low because the Bureau doesn’t have the data yet to provide a better picture of what’s really happening. But for now, we have to assume it’s right and, if so, add it to our list of worries.
Even so, these figures — especially those showing which areas of spending are growing fastest — challenge the general picture of an Australia in which ordinary people have their backs to the wall. Frugality does not leap out at you from these numbers.
5. The professional sectors are enjoying strong growth. The health and welfare sector had both the biggest absolute growth and the fastest pace of growth of any industry over the twelve months to June, its output swelling by 6.9 per cent. The NDIS accounts for part of that, but most of it reflects the increasingly central role of healthcare in an ageing society. The financial sector and the professional and scientific services sector — accountants, lawyers and the vast range of consultants — were also among the five sectors with the biggest growth. The financial oligopoly has had decades of unrestrained pricing power that has allowed it to appropriate an ever-increasing share of the nation’s income and become the biggest sector of the economy. Its profits rose in 2017–18 by another $7.5 billion — a growth of 7.4 per cent. They’ve had better years, so you can see why the poor old things are having to raise their interest rates to ensure profits keep rising.
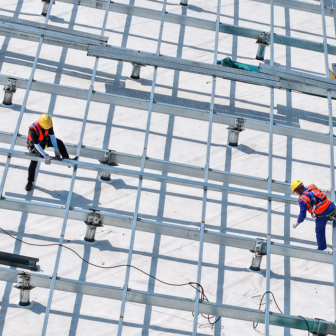
6. The blue collars are also doing well. Mining had the second-fastest growth in the volume of output (up 6.1 per cent), and the unexpected boom in coal prices meant its revenues went up even faster. The revival of business investment and the peaking of the booms in housing and public infrastructure made construction the next fastest-growing industry (up 5 per cent). Even manufacturing rebounded in 2017–18, its output growing 2.9 per cent after five years of falling output shrank the sector by 10 per cent.
7. A good year for business, a bad one for wage-earners. Corporate profits rose 8.3 per cent through the year, helped by those record coal prices, and the lack of countervailing power among workers. By contrast, total wage and salary income rose only 4.9 per cent, and the average compensation per employee by 1.7 per cent. At least that was a marked improvement on the 0.3 per cent wage growth in the previous year.
There was plenty of work around, and that benefits those looking for work and those with less work than they want. Hours worked grew 2 per cent last year, and 5 per cent over the past two years. As a result, last year saw the biggest rise in total wage income for six years — because cheap workers got hired.
But is this operating in the interests of workers as a whole? Not yet, maybe never. Over the past six years, the average compensation per employee has risen by just 1.4 per cent a year, partly because most new jobs created have been part-time. And in that time, household income from wages — which includes both employment growth and wage growth — has grown on average by just 3.1 per cent a year.
All the new treasurer could say to console us was that the Reserve Bank is confident that, eventually, the tighter job market will cause wages to rise. Sorry, Josh, I know you’re new in this role, but the Reserve has been saying this for years and has got it persistently wrong, but it keeps repeating its mantra without asking itself why it hasn’t worked.
Here’s a clue: next time you talk with Reserve governor Philip Lowe, ask him why, after telling us that the economy needs bigger wage rises, he nonetheless insisted that the Reserve’s own staff should make do with wage rises of 2 per cent a year. Australia’s unemployment is only in the middle of the pack of Western countries — half of them now have lower unemployment than we do — but few of them have seen wages pick up significantly.
There is a deep-seated culture among the business elite that expects and welcomes big pay rises at their own level yet suppresses them among their workers. Menzies would have taken business leaders on over this class warfare, but no Liberal leader today would do so. It’s a reform the next Labor government will have to tackle.
8. Investment has stalled — and public sector infrastructure investment is falling. Year on year, investment grew by 2.8 per cent, but that growth had slowed sharply by June. Home-building activity, which had been falling, rebounded in the first half of 2018 — but private business investment, which had been rising, fell unexpectedly, with activity shrinking 2.5 per cent in the June quarter after seasonal adjustment. With housing approvals, prices and finance all sliding, it is hard to see home building generating momentum in 2018–19. And the Bureau’s latest survey found business expecting to invest less this financial year than it had in the same survey last year.
The lack of a private investment driver would not matter so much if government infrastructure investment matched the hype. But as I have pointed out here before, federal and state governments have worked out a way to fool us on that. They announce bigger and bigger projects — WestConnex, a railway to Melbourne Airport, and now Daniel Andrews’s thirty-year plan to build a seventy-kilometre rail loop under Melbourne’s outer middle suburbs — and use that to disguise the reality that they are planning to build less.
On the seasonally adjusted figures, governments in the June quarter invested almost $2 billion less than a year earlier, down 8.1 per cent. The Andrews government is planning a big election year spend this year, followed by sharp cuts to infrastructure spending ahead. The federal government has already cut its infrastructure investment. This is now a headwind slowing the economy, not a source of growth.
9. By contrast, routine federal government spending is booming. The national accounts report that in the first four years of the Abbott–Turnbull–Morrison government, its spending (excluding investment) increased by 22.8 per cent in real terms. That’s an average annual growth of 5.25 per cent in real terms, or 7.25 per cent including inflation. In sharp contrast, household spending grew by just 11.2 per cent over the same four years, and state and local government spending by 11.1 per cent.
Where did the feds get the money? From us. Income tax collections shot up 25 per cent in those four years, the company tax take rose 28 per cent, and tariff revenue — with imports replacing local manufacturing — climbed 69 per cent. (The accounts note that imports now account for 40 per cent of domestic sales.)
And, like Labor before it, the Coalition keeps spending far more than the taxes it collects, which is why Australia is still in deficit ten years after the crisis that put us there.
10. The drought is starting to bite. Farm output in the June quarter shrank by almost 10 per cent from a year earlier, which had been the first good year on the land for almost a decade. When will the National Party, which supposedly represents farmers, admit the reality of climate change and try to do something to stop it?
One thing the national accounts don’t tell us about are housing prices, which are now falling in most Australian cities. In itself, the fall is not a problem — in six years, prices had shot up by 85 per cent in Sydney, 67 per cent in Melbourne and 52 per cent nationwide, and no one should have expected them to stay there, let alone keep rising. The trick for the federal government and the Reserve Bank will be to manage that inevitable and welcome decline so that it makes housing more affordable without causing a collapse that could destabilise the economy.
And the accounts can’t reflect the other great risk we face: the fallout from Donald Trump’s trade war against China, and China’s own attempts to correct its unsustainable reliance on debt and overinvestment. Negotiations between the two superpowers have broken down, and China has suggested they be resumed only after November’s congressional elections. If current voting intentions are reflected on election day, that could see Trump’s Republicans routed — which might make him more willing to deal.
We live in dangerous times. The risks are rising, and the year ahead could have less good news on the economy than the last one. •