An eventful first sitting week of the new parliament saw the Turnbull government introduce legislation for a raft of savings measures, some of them already announced in this year’s budget, some foreshadowed in the 2015–16 Mid-Year Economic and Fiscal Outlook, and some “zombie” savings left over from the 2014 and 2015 budgets.
In all, the Budget Savings (Omnibus) Bill 2016 contains twenty-four measures totalling $6.1 billion. During his second reading speech, treasurer Scott Morrison described them as the first instalment of $40 billion in budget improvements the government will be seeking to legislate in coming months, including some $25 billion in expenditure savings.
Of the $6.1 billion savings in the bill, roughly half comes from social security payments, with the plan to abolish the “carbon tax compensation” for new social security recipients contributing the single biggest share (about $1.3 billion over the period up to 2019–20). Savings from a range of these measures will be deposited into a special account to help fund the National Disability Insurance Scheme.
So far, most of the opposition to the cuts has focused on the carbon tax compensation cut, which would close the energy supplement to new recipients from 20 September (although transitional arrangements would apply for six months). Payment for recipients of Newstart and Sickness Allowance would fall by $4.40 for singles and $7.90 for couples per week, a cut of 1.6 per cent.
Recipients of these payments, which are already low by any comparable national or international benchmark, already stand to lose another payment, the income support bonus, after a final half-yearly instalment – $111.50 for singles and $185.60 for couples, also a 1.6 per cent cut – this September.
No longer paying compensation for a scheme that has been abolished might seem reasonable, but the compensation package also included income tax cuts for people earning up to $80,000 per year, and most of these tax cuts remain in place. On top of that, closing the supplement means that Newstart will actually be lower than it would otherwise have been for the newly unemployed. This is because the supplement was used to offset indexation increases that would otherwise have applied to Newstart itself.
While opponents of the closure of the energy supplement have focused on its impact on Newstart recipients, it would also affect future recipients of most government payments, including the age and disability pensions, parenting and carer payments, the youth allowance, and the family tax benefit, or FTB. Existing recipients of these payments could also lose the supplement if their income, employment or other circumstances change.
These savings come on top of a complex set of cuts that already affect singles and couples with children. Along with the income support bonus, the Abbott government abolished the schoolkids bonus. The last instalment, paid in July, was worth $215 for each primary school and $428 for each secondary school student receiving youth allowance or whose parent(s) had a (combined) annual income of less than $100,000.
Other changes already legislated have affected families with two or more children and tightened eligibility for FTB part B, or FTB-B. Large families who receive FTB no longer collect the large family supplement, which would have been worth $332.15 this financial year for each child after the third. The government has also removed FTB-B from couples once their youngest child turns thirteen, and from singles and couples where an individual earns more than $100,000 per year – a process begun when the previous Labor government introduced a limit of $150,000.
The government intends to extract further savings from FTB, and has repeatedly stated that the introduction of its childcare package depends on parliament’s accepting those other proposals. Most are zombie measures left over from the 2014 and 2015 budgets; they are estimated to involve about $9.1 billion in savings over the four-year projection period, less increased spending on childcare of $3.2 billion, giving net savings of around $5.9 billion. Around two-thirds of the $9.1 million was to come from changes to social security payments.
The largest of these savings would come from phasing out the FTB end-of-financial-year supplements. The FTB–A supplement is currently worth $726.35 per child, and the FTB–B supplement $354.05 per family. The government would reduce these amounts to $602.25 and $302.95 this financial year, halve them for the 2017–18 financial year, and then abolish them altogether. It would partially offset this loss on 1 July 2018 with a one-off increase to the level of FTB–A of $262.80 per child (which, according to our reading of the draft legislation, would apply only to the so-called maximum rates). Nonetheless, even the most disadvantaged families stand to lose more than $450 per child per year, plus a further $350 per year if they also receive FTB–B, as a result of the proposed savings measure.
Another measure would prevent new recipients from gaining access to the single income family supplement, which is available to families with only one main earner on an annual income of between $68,000 and $150,000. The supplement is currently worth $300, almost as much as the tax cut.
The government is also proposing to extend an existing pause on the indexation of the FTB–A base rate income threshold for a further three years. The threshold is currently set at $94,316, and families whose income exceeds this amount lose 30 cents of the benefit for each extra dollar they earn until their FTB–A payment reduces to nil. The threshold has remained at $94,316 since 1 July 2009, when the Rudd government paused its indexation for five years; after the Gillard government extended the pause for a further three years, indexation was set to recommence on 1 July 2017. The government now proposes to extend the pause for a further three years. In the first year alone, according to our calculations, families on incomes over $94,316 would lose up to $350.40, more than the tax cut.
Other measures in the legislation introduced last week include reducing the level of FTB–B for lone parents once their youngest child turns thirteen, from the current rate of $2832.40 per year to $1000.10; keeping young people on youth allowance until they turn twenty-five; pausing the indexation of income support income-test thresholds for three years; abolishing the job commitment bonus, and the education entry payment and the pensioner education supplement; and pausing the indexation of the FTB–B and paid parenting leave income limits.
On the subject of parenting leave, the government still intends to prevent what it calls the “double-dipping” while providing a one-off boost of $1000.10 to the level of FTB–B for families with a newborn child along with its other childcare reforms.
At the same time, the government appears set on pushing through the tax cut announced in the May budget, which would apply to annual incomes of $80,000 or more. Starting from 1 July this year, individuals on incomes of over $87,000 would pocket $315 – unless they are parents in receipt of FTB, in which case they could find their tax cut effectively voided by other savings measures targeting higher-income families.
Household impacts
Following the 2014 budget, we calculated that the changes proposed at the time would have had a disproportionate impact on low-income households. Since then, many of the 2014 measures have stalled or been modified. Using the same approach as in 2014, we have assessed how the measures listed here add up:
Measures modelled
Measures introduced since the 2013 election
Repeal clean energy income tax changes
Cease indexation of the energy supplement
Abolish the FTB-A per child add-on
Reduce the FTB-B income limit to $100,000
Abolish the FTB-A large family supplement
Restrict FTB-B to couples with a child under thirteen years
Abolish the schoolkids bonus
Abolish the income support bonusMeasures proposed in the 2016 budget
Increase the income tax threshold for 37 per cent rate to $87,000
Close the energy supplement (in the Omnibus Bill)
Close the single income family supplementOther unlegislated measures
Pause indexation of income support thresholds for three years
Reset the FTB-A end-of-year supplement to $302.95
Reset the FTB-B end-of-year supplement to $153.30
Reduce the FTB-B standard rate for children aged thirteen-plus to $1000.10
Pause indexation of the FTB-A upper threshold for three years (pause for two years included in the Omnibus Bill)
Pause indexation of the FTB-B income limit for three years
We show our estimates of the impact on households of the social security and tax changes in a simplified version in the table below (and in a more detailed way in the version of this article available on Australian Policy Online).
Once again, we use what is called the “cameo approach.” We take a range of hypothetical, working-age households in defined circumstances – according to the number and ages of their children (if they have any) and the split in earnings between adults in a couple, at a range of private incomes at specified levels from zero earnings (that is, receiving maximum benefits) in increments of $20,000 per year up to $200,000 per year. We then model the effects on their disposable incomes of the changes identified in the list above.
Not all the changes discussed in the previous section are modelled; for example, we don’t take into account changes in paid parental leave, and nor do we take account of abolishing the job commitment bonus, the education entry payment and the pensioner education supplement, as these changes will affect people in very specific circumstances and not households in general, and indeed we have not modelled most of the measures in the Omnibus Bill (many of which are compliance measures). If we included these, then some of the affected families could lose even more than shown.
The starting point for our estimates is the tax and benefit system at the time of the 2013 election, assuming the continuation of these policies until the 2017–18 year. Changes actually passed by parliament are shown as results at the time of the 2016 election (legislated measures in the table below), and are compared to what would be the situation in 2017–18 if the 2016 budget measures are passed, with the effects of the zombie or other unlegislated measures. All dollar amounts are expressed in 2017–18 values.
The detailed tables supporting this analysis separate out the effects of changes in fortnightly rates of payment and changes in lump sums received in the financial year. Generally speaking, the negative effects for single people and couples without children come from changes in fortnightly payment rates, while for families with children the most significant losses are caused by proposed changes in lump sum payments.
Change in disposable income due to legislated, budget 2016, and other unlegislated (“zombie”) measures calculated for 2017–18 compared to policy at election 2013
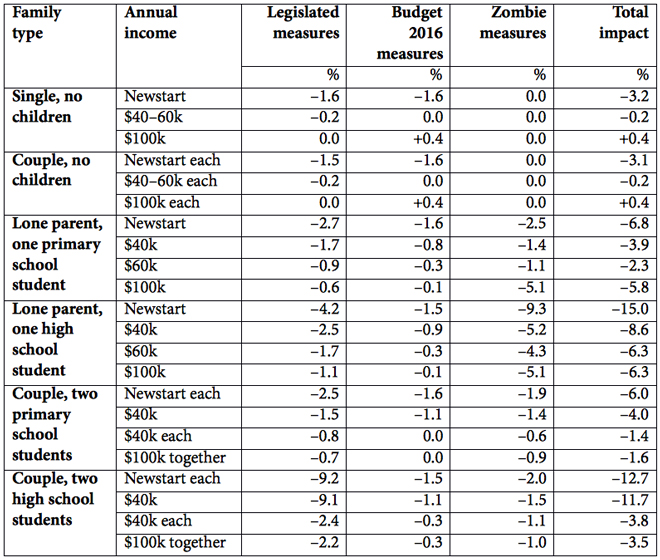
For single people with no private income who are fully reliant on Newstart, legislated measures have already caused a loss of around $236 per year or 1.6 per cent of disposable income. The impact of the passing of the 2016 budget (including the zombie measures) is a further decline in disposable income of around $230 per year, with a total impact of around 3 per cent of disposable income. Losses decline in percentage terms as income increases. Above $80,000 per year, individuals start to gain because of the increase in the threshold for the 37 per cent marginal tax rate from $80,000 to $87,000, producing small positive net gains of between 0.2 and 0.4 per cent of disposable income. (We have not factored in the ending of the temporary deficit levy because it will have expired by legislation.)
For couples without children the patterns are similar. Those on income support payments experience reductions in real disposable income of around $400 per year, with a further $410 per year as a result of Budget 2016 measures; the combined impact is around 3 per cent of disposable income. Losses decline as income rises, and gains start to accrue when one partner earns more than $80,000 per year. These gains depend on the split of the partners’ share of household earnings, with partners who earn the same benefiting most because they both have access to the increase in the 37 per cent threshold once they earn over $80,000 per year.
For lone parents, the already legislated measures bring losses that are greater in dollar terms at higher incomes because of the abolition of FTB-B for those above $100,000 per year. For lone parents with no earnings, that legislation will cause losses of between 0.8 and 4.2 per cent of disposable income for a lone parent with one child, with the higher loss being for those with a child aged over thirteen. Lone parents with two teenagers will lose 5.8 per cent of their disposable income from already legislated measures.
Budget 2016 measures would cause further losses of around 1.6 per cent of disposable income, or between $400 and $570 per year, for most lone parent families on benefits, with the losses declining as a proportion of income and small gains for very high–income lone parents.
The other unlegislated measures cause further losses of just over $600 per year for most lone parents with one child and $2500 where the child is a teenager. Losses are greater for families with a youngest child over thirteen years because of the changes to the structure of FTB-B and they also increase with the number of children because of the ending of the end-of-year supplements for FTB-A payments. Generally speaking, losses are proportionately greater at lower income levels because of the ending of end-of-year lump sum payments for FTB-A and B.
The cumulative effect of all these changes is starkest for lone parents on Newstart with a teenager: they will lose 15 per cent of their disposable income. What is also striking is that lone parents with older children have already experienced a large drop in levels of income support since the “welfare to work” reforms introduced by the Howard government in 2005–06 and the moving of “grandfathered” lone parents from parenting payment single to Newstart by the Gillard government in 2013.
For couples with children, the patterns are broadly similar to those facing lone parents, with a couple with two primary school–age children on benefits losing around 6 per cent of their disposable income and a similar couple with teenage children losing nearly 13 per cent of their disposable income.
While the losses tend to be proportionately greater at lower incomes, they are still substantial for those who are in work. A single-earner couple with one pre-school child, earning around $80,000 per year would lose more than $1000 per year out of their take-home pay of $68,000 as a result of the 2016 budget measures and other unlegislated measures. Similarly, a lone parent, with a teenage child, earning $60,000 per year cumulatively loses more than $3600 out of a disposable income of around $57,700.
It’s important to note some qualifications to these calculations. Our benchmark is the policy settings in place following the 2013 budget. If the Labor Party had won the 2013 election, there would very likely have been changes in policy settings over this period; and Labor had proposed a number of savings measures during the election campaign. So the household impacts should not be taken as a measure of the difference between the effects of the policies of the Coalition and Labor. In addition, households would still be paying the “carbon tax” if Labor were still in office, although its average household impact is well below the losses for low-income groups we’ve described.
Nor have we factored in the impact of the government’s proposed changes to childcare policy. As we pointed out after the 2015 budget, these changes would generally be progressive for the families receiving childcare support. They could also have a positive effect on labour force participation and improve incomes for those moving from welfare to work. But the winners from these changes would be families with preschool children, while the major losers from family payment changes are families with teenage children.
Assessing the trade-off
Australian governments seeking “budget repair” inevitably face difficult choices. Social security and welfare accounts for about a third of federal government spending, and is an inevitable place to look for expenditure savings.
But the Australian social security system is more targeted towards the poor than any other rich country. As the chart shows, more than 40 per cent of spending on cash benefits in Australia goes to the bottom 20 per cent of the income distribution – a share higher than any other country – while less than 4 per cent goes to the richest 20 per cent of the income distribution – far lower than any other country.
Share of social benefits going to low-income households varies considerably across the OECD
Percentage of public social benefits in cash paid to the lowest and highest quintiles, total population, 2011
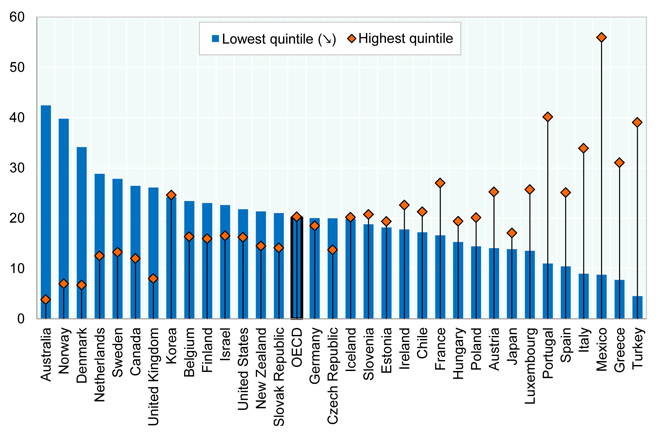
Source: OECD, Social Expenditure Update, 2014.
This means that proposals to cut social spending inevitably raise questions about distributional impact. While this is true in all countries seeking to deal with large budget deficits, it is more acute in Australia, with cuts in social security potentially having a larger impact on income inequality and poverty than in any other rich country.
A significant part of the difficulties faced by the Coalition government since 2013 relates to the perceived unfairness of its first budget. It’s true that some of the most striking features of that budget – particularly the proposal to make young people wait six months before they could receive Newstart benefits – have been watered down. But its savings measures, including the zombie measures, would still have the largest negative effect on low-income groups in the Australian population.
The question of what constitutes a fair distribution of income, and of taxes and spending, is not straightforward. Our estimates clearly show that the percentage losses in income are greater for low-income groups than for high-income groups, particularly for lone parents with older children whose benefits have already been cut significantly over time. It therefore seems highly likely that these measures will be the subject of ongoing debate. If, as a result, they are not passed by the Senate then the road to reducing the budget deficit may remain blocked.
There are always alternative ways of reining in the deficit, of course. Assuming that this is the right time for tackling the budget problem, there is no reason why an alternative package, broadly distributionally neutral in its impact, couldn’t be designed. The task would be complex, but microsimulation models – such as those run by the University of Canberra’s NATSEM and the ANU Centre for Social Research and Methods – could undoubtedly identify how to balance competing concerns for fairness with measures to reduce the budget deficit. •