THIS week’s federal budget included a package of reforms designed to help people receiving a disability support pension, or DSP, get into work. Disability support pensioners under the age of thirty-five who have some capacity to work will now need to meet new participation requirements. New rules will require new applicants to use employment assistance to try to get back to work before they can apply for the DSP. More generous rules will be used to encourage existing disability pensioners to work more hours. And employers will be given new financial incentives to take on more disability pensioners. According to the treasurer, Wayne Swan, these initiatives are partly intended “to slow the growth” in DSP numbers.
Concern about the number of people receiving the DSP has been voiced increasingly in recent months. In a series of speeches – at a CEDA Luncheon in February, in the inaugural Gough Whitlam Oration in March, and in an address on “The Dignity of Work” at the Sydney Institute in April – the prime minister, Julia Gillard, has argued that “we have moved beyond the days of big government and big welfare, to opportunity through education and inclusion through participation.” In addition to the unemployed and discouraged job-seekers, she said, “there are many thousands of individuals on the Disability Support Pension who may have some capacity to work.”
In an address to the Queensland Chamber of Commerce and Industry, opposition leader Tony Abbott suggested introducing a more targeted payment for people whose disabilities might not be permanent. He pointed out that Australian disability pension numbers are set to pass 800,000, with more working-age people on the disability pension than on unemployment benefits.
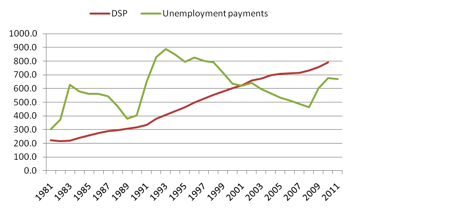
Figure 1 shows the trends underlying these concerns. Over time, the number of people receiving unemployment payments has varied dramatically depending on labour market trends, with a large increase in the early 1980s, a further and larger increase in the early 1990s, a sustained decline until 2007, and a substantial increase (though much lower than in the recessions of the 1980s and 1990s) following the global financial crisis.
The contrast with the number of people receiving the Disability Support Pension is striking. Indeed, a Parliamentary Library briefing note on last year’s budget pointed to an “inexorable” growth in numbers over the past twenty years, adding: “No other income support program has seen this level of sustained increase.”
Figure 1: Trends in the number (thousands) of recipients of Disability Support Pension and Unemployment payments, 1981–2011

Note: Figures are at June each year, except unemployment payments in 2011, which are for March. DSP numbers for 2010 are preliminary.
Source: FaHCSIA, Income Support Customers: A Statistical Overview 2009
Is the DSP out of control? Is disability really rising in the Australian community or are people who are really unemployed being “parked” on the DSP? Are individuals manipulating the system to get more from these benefits? These concerns might appear justified because there are clear incentives for long-term welfare recipients to qualify for the DSP, as the gap between the DSP and Newstart payments is nearly $260 per fortnight, and widening.
To fully understand these trends in DSP numbers, though, we need to consider a range of factors, including population size and the age profile of disability in Australia, the effects of income-support policy changes, and the state of the labour market.
The boomer effect
Over the past fifteen years the population of Australia has been growing relatively rapidly, and the growth in numbers of DSP recipients is partly a consequence of that. What is important from a policy perspective is the rate of DSP support – the number of recipients as a percentage of the working-age population. And that rate has basically been stable since 2002, although it fell a little just before the global financial crisis and has risen a little since then.
Disability and receipt of the DSP are strongly age-related. In 2009, for example, less than 2 per cent of people aged sixteen to twenty-nine received the DSP, but this rose with age to 5 per cent of people in their forties, 9 per cent of people in their fifties and over 14 per cent of people aged sixty to sixty-four years. Disability rises further as people age beyond sixty-five years, but after sixty-five most people are entitled to an age pension and the DSP is no longer relevant.
This age profile is important, because the age structure of the Australian population has also changed significantly over the past fifteen years. This is an effect of the ageing of the baby boom generation, conventionally dated to those born between 1946 and the early to mid 1960s. Analysis by demographer Natalie Jackson shows that up until 1996, changes in the age structure of the Australian population had a slightly negative effect on the trend in DSP numbers.
The first of the baby boomers started to turn fifty in 1996, so from that point changes in the age structure of the population became likely to increase levels of receipt of the DSP.
Overall, between 1996 and 2009 the proportion of people of working age receiving the DSP rose from 4.3 per cent to 5.1 per cent. If the age structure of the population was held constant at 1996 shares, then rather than there being 5.1 per cent of the population receiving the DSP there would be 4.7 per cent. This means that about half of the total increase in numbers was the result of population ageing unrelated to any changes in the labour market, to the incidence of disability or to individual behaviour.
Declining dependency
A series of policy changes from the mid 1990s onwards also had a major impact on the number of people receiving the DSP. The most important of these was the increase in the age at which women qualified for the age pension from sixty to sixty-five, which started in 1995.
In 1996 only 3400 women aged sixty to sixty-four years received the DSP, but 194,000 received the age pension. In 2009, there were 68,000 women aged sixty to sixty-four receiving the DSP, but 81,000 female age pensioners. Women in that age range are the fastest growing group of DSP recipients, with the DSP now accounting for close to 30 per cent of social security benefits claimed in this age group. In 1996, by contrast, it accounted for just 1.4 per cent of welfare received in this age group.
At around the same time as the lift in pension age, the government began to phase out a number of other payments, including mature age allowances, the partner allowance, the wife and widow B pensions and the widow allowance. These changes had a big impact on how many people received welfare payments as well as which payments they received. For example, in the mid 1990s around 4 per cent of the working-age population, mainly women, received these “closed payments” but now that figure is only 1 per cent.
While the combined impact of these changes means that the number of DSP recipients in this group has “skyrocketed,” the total number claiming welfare has plummeted. In 1996 68 per cent of women aged sixty to sixty-four years received a social welfare payment; by 2009 it was 39 per cent.
So “welfare dependency” for this group has actually fallen significantly – it’s just that more of this (smaller) group are now on the DSP. And this reduction among older women is matched by a reduction among older men: in 1996 26 per cent of men aged sixty to sixty-four years were receiving the DSP; by 2009 it was 16 per cent.
The pension age for women has not yet reached sixty-five years, so the number of women in this age group receiving the DSP might continue to rise. Moreover, the announced increase in the age pension age to sixty-seven years for both men and women, to be phased in between 2017 and 2023, will undoubtedly mean that the number of DSP recipients will increase. But given the recent experience among women aged sixty to sixty-four years it could be expected that the total proportion of sixty-five and sixty-six-year-olds reliant on social welfare payments will fall.
Rather than a welfare spiral, what has actually happened over that decade and a half is a significant decline in the proportion of the working-age population receiving social security benefits; and the decline would have been even greater if not for the structural ageing of the population. This decline is the result of reforms introduced in the 1990s and reinforced by very strong labour market growth between 2002 and 2007.
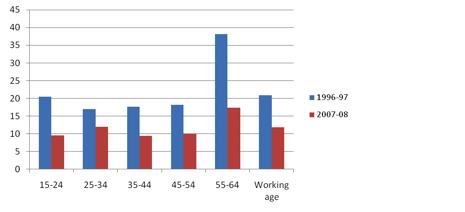
Figure 2 shows that the declines in welfare reliance among people of working age between 1996 and the period just before the global financial crisis were significant for all age groups, but the largest declines were among those where the household reference person was aged fifty-five to sixty-four years.
Figure 2: Per cent of households with a household head of working age whose principal source of income is government cash benefits, by age of household head, 1996–97 and 2007–08

Note: Principal source of income is 50 per cent or more of total income.
Source: ABS, Household Income and Income Distribution Survey, 2007–08
Welfare reliance in this group more than halved from 38 per cent to 17 per cent, and the overall proportion of working-age households who derive 50 per cent or more of their income from benefits fell from 21 per cent to 12 per cent. If a more stringent definition of welfare dependence is used – households who receive more than 90 per cent of their income from government cash benefits – then the decline in welfare dependence among people of working age is even greater – from close to 17 per cent to 7.2 per cent. Adjusting for changes in the age structure of the working-age population further reduces this to 6.7 per cent.
The other arguments for reform
There are very strong arguments in favour of further welfare reforms, but these are arguments based on improving equity, not constraining growth in numbers. The key equity argument, mentioned by the prime minister in her speeches this year, is simple: the main path to improvements in social inclusion is through increases in employment and participation.
In Australia, about 40 per cent of working-age people with a disability are employed, which is below the OECD average of 44 per cent. The OECD finds, however, that the relative incomes of people with a disability are lower in Australia than in any other OECD country and poverty rates are the second highest. Most of the explanation for this lies in the fact that those who are not in paid work receive lower incomes. To improve equity, we therefore need both to increase employment and to improve benefit rates. The government has already lifted benefit levels for people on the DSP (and age and carer pensions), and the budget package announced this week has been welcomed by welfare groups such as the Brotherhood of St Laurence as balancing increased obligations with improved support services.
Nevertheless, population growth, continuing population ageing, the ongoing effect of past policy changes and the future increase in the age pension age to sixty-seven years are likely to mean that the numbers on the DSP will continue to grow for some years. This doesn’t mean that these reforms will necessarily fail. To judge the success or otherwise of the budget, we need to take account of age and gender-specific rates of DSP receipt, and we also need to look at the total rate of welfare receipt. •


