Polling of voting intentions over the past thirty years appears to show a steady weakening in support for the Coalition parties — that is, the Liberal and National parties — among older Australians. Why? In 2011 I raised the possibility that the drop might be explained by the ageing of the population, and particularly the “bulge” of baby boomers moving into their mature years or into retirement and gradually displacing an older, more conservative generation. After all, the boomers are the Woodstock generation, raised on feminism, environmentalism and opposition to war. But there’s also a countervailing factor — as sociologists tell us, people often take on more conservative values as they age. So it’s not a straightforward case of which “generation” you belong to.
Let’s start by looking at the evidence. In this case it’s voting-intention data from the three months leading up to each federal election, when Newspoll (who provided the 1987 to 2010 data) and Essential Research (2013 and 2016) asked voters about the forthcoming election. Newspoll used computer-aided telephone interviewing of randomised respondents from the general population, Essential used an online panel, and in both cases only respondents’ primary voting intention, not their preferences, was included. Using results grouped in five-year age brackets we can tabulate how respondents are likely to vote at different ages. By comparing each age group against the all-age average, we can then pinpoint age-related patterns.
Why do it this way? Elections come and go, and support for the major parties waxes and wanes: 1996 was a triumph for the Coalition, 2007 for the Labor Party. By using the gap between the age-specific average and the all-age average, we can see shifts in age-group support independently of overall ebbs and flows. I’ve shown these gaps by graphing the data from the opinion polls as bar charts, with the height of the bars indicating the size of the gap, and the direction — up or down — indicating whether the gap favours that party or not.
Chart 1: Voter support for the Liberal–National Party Coalition, 1987–2016
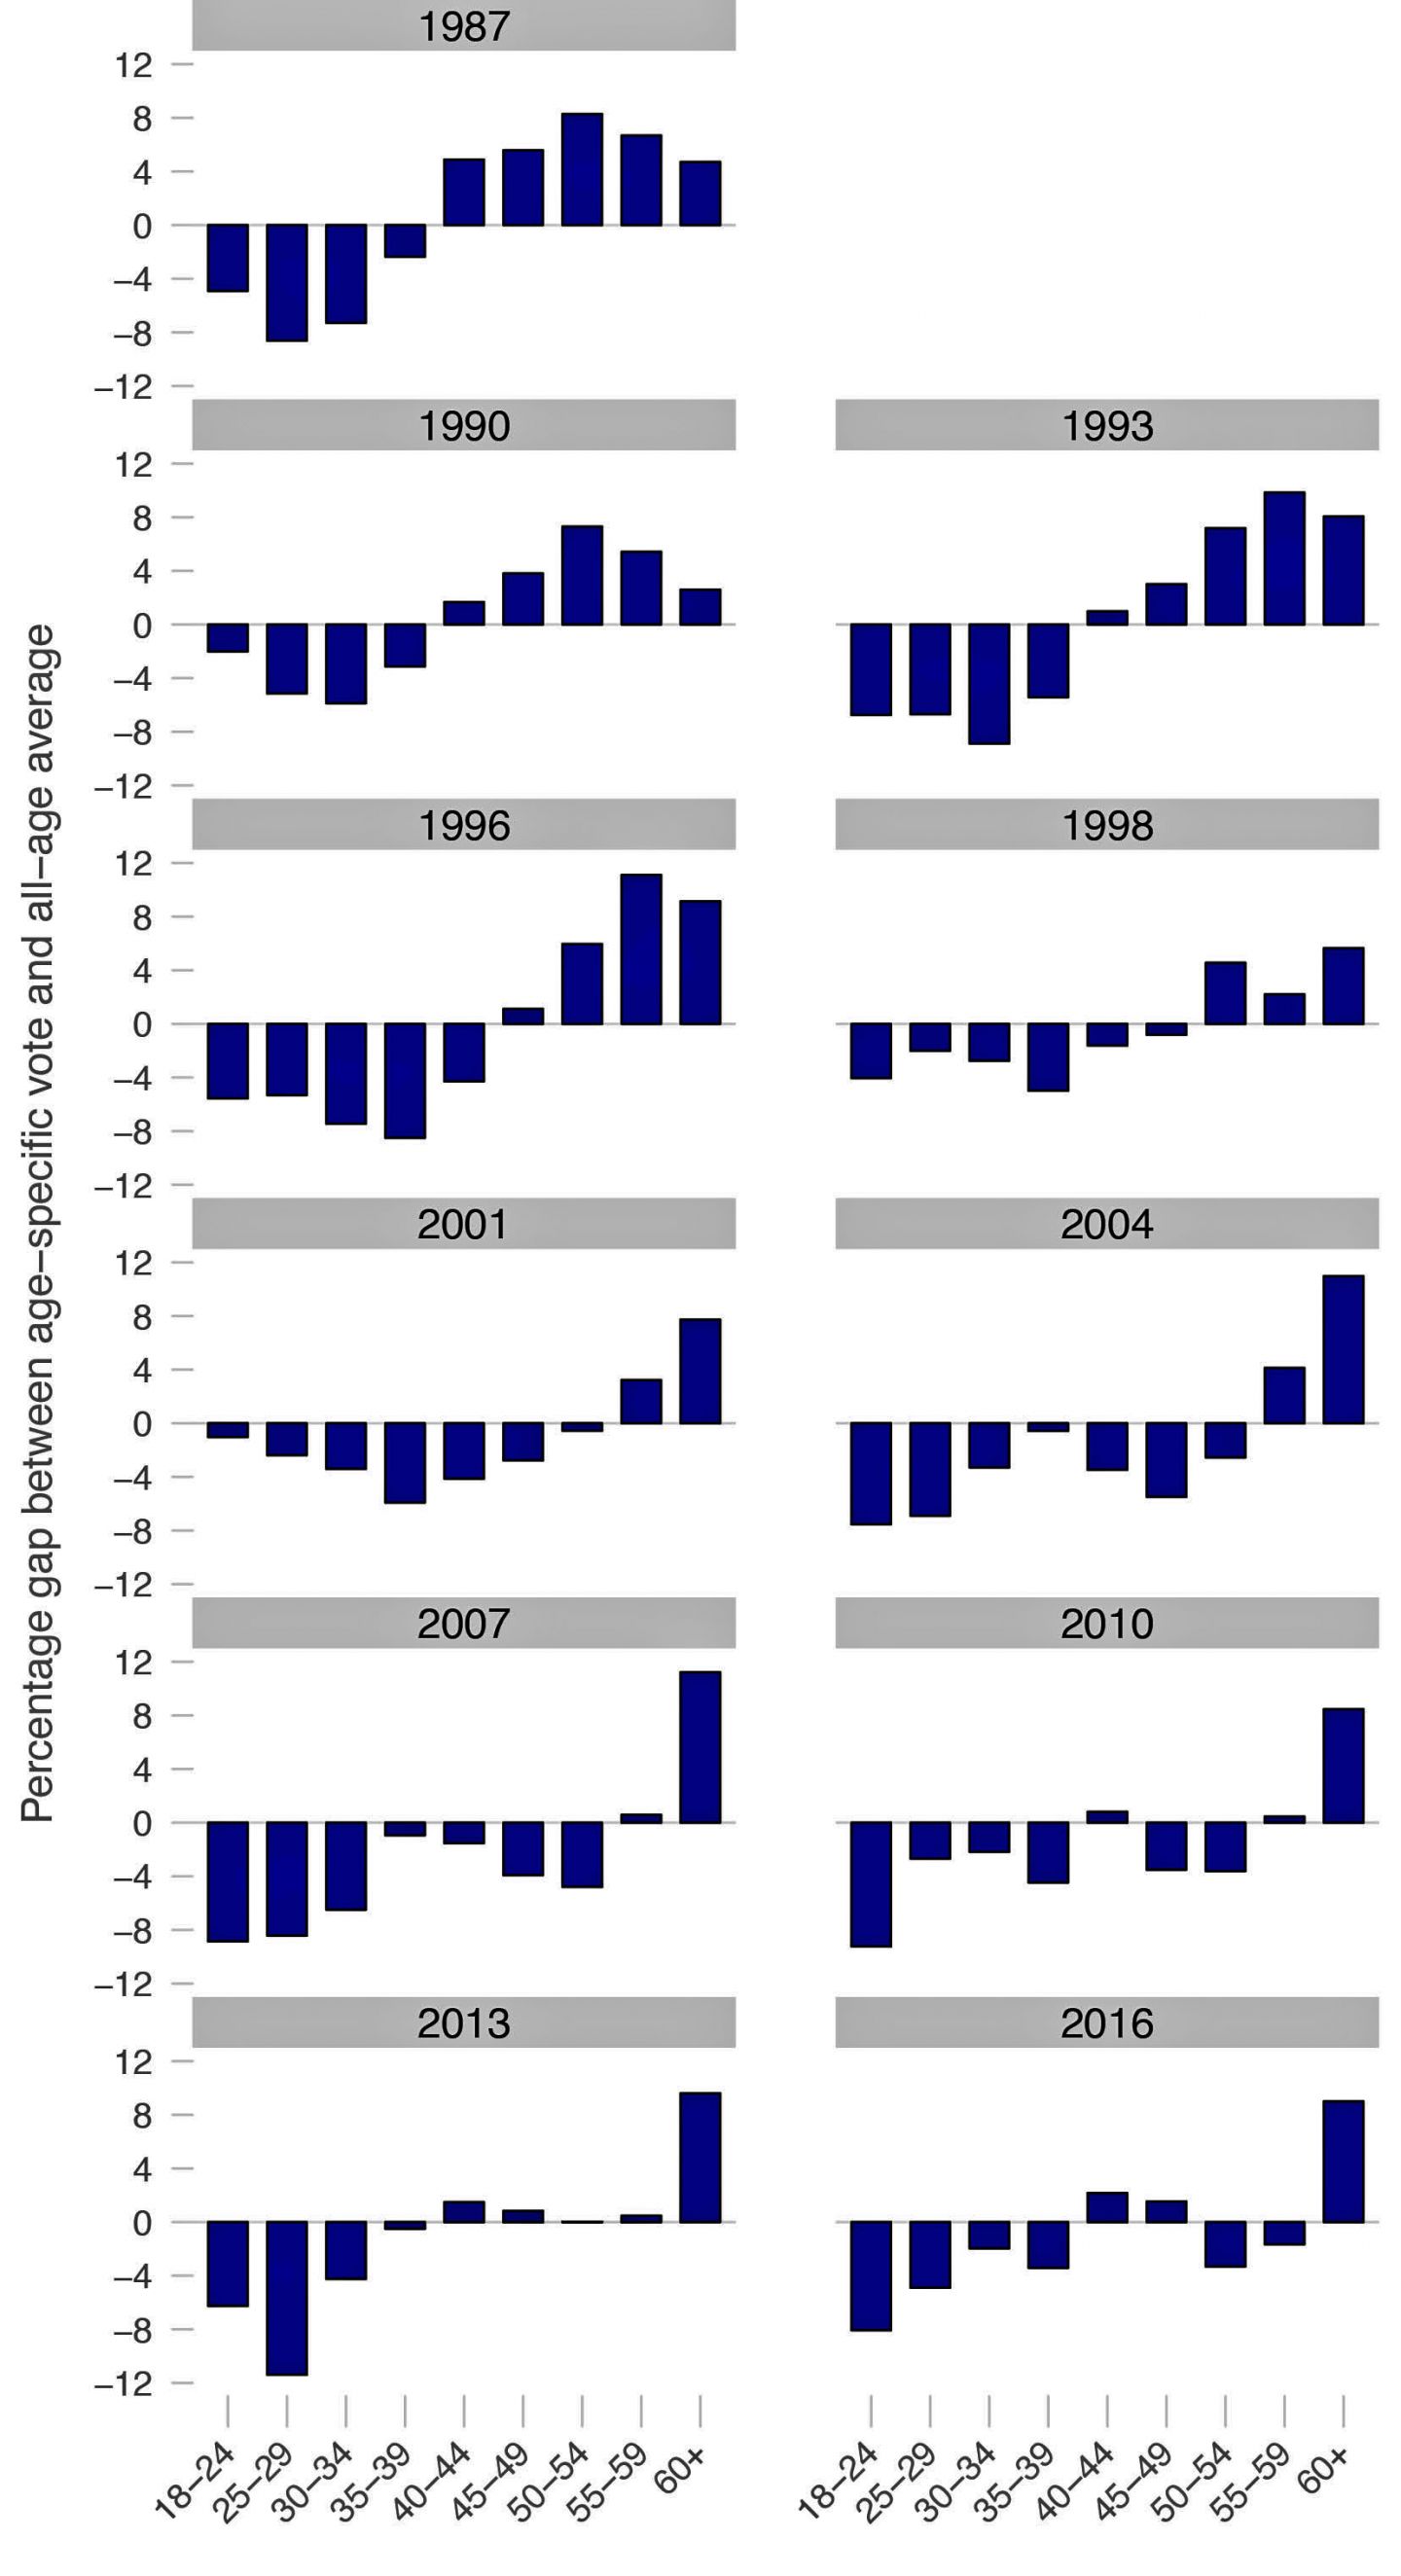
Source: Author’s calculations using Newspoll and Essential Research data. See technical note at the end of this article.
Chart 1, which shows the age-related pattern of support for the Coalition from 1987 to 2016, shows a changing pattern of support over time. During the late 1980s and early 1990s support for the Coalition was based on middle-aged and older Australians (indicated by positive bars for those age groups). As the 1990s wore on, its support became more concentrated among the older age cohorts, and particularly those over fifty. By the early 2000s, support was almost exclusively to be found among those aged over fifty-four, with a very large concentration in those aged sixty and over. Since 2007 this group of older Australians has become the bastion of Coalition support: as they have aged, their voting patterns have remained wedded to that side of politics.
In the hope of deepening that trend, the Coalition has increasingly favoured seniors in its policy-making. Back a decade, before the Kevin07 landslide swept it from office, the Howard government shrewdly crafted a political deal that welded the “seniors’ vote” to the fortunes of the Coalition. Howard’s largesse towards older Australians was legendary; as Saul Eslake caustically observed, “Self-funded retirees were a protected species.” Among the measures that favoured both the wealthy and retirees, Eslake listed the senior Australians tax offset and tax-free superannuation for over-sixties. Treasurer Peter Costello’s 2007 budget, unveiled the year the Coalition lost office, saw a $1.4 billion package targeted at older Australians, including a “seniors bonus payment.”
The electorate repaid the favours. Throughout the Howard years older Australians consistently voted for the Coalition. Retirees became the Howard heartland: in 2004 some 56 per cent of voters aged sixty-five or over intended to direct their first preference to the Coalition, and in 2007 the figure was 53 per cent. These figures contrasted with an all-age average of 44 per cent in 2004 and 40 per cent in 2007.
What about the “baby boomers,” the cohort born a generation behind these Howard stalwarts? Did they retain their progressive values as they became older, mortgaged and time-poor? Dealing with this question is far from easy, and there is no precise answer. First, we face methodological issues: how do we separate the ageing effects (the impact of getting older on voters’ preferences), period effects (the historical context) and cohort effects (a particular generation)? Second, these polling data define age in five-year bands, but the gap between federal elections is generally three years (and occasionally less). So, even if we identify a baby boomer cohort in 1987, for example, we can’t neatly track them through the data, election by election.
Then there is the issue of who fits into the definition of a baby boomer. Some commentators use the term to encompass people born between 1946 and 1964, but those born at the tail end of this period would only have reached their late teenage years as the 1970s ended. How likely would they have been to share the values of their older sisters and brothers who lived through the political and cultural turmoil of the 1960s and early 1970s?
Finally, we shouldn’t assume that even those who fitted into the earlier cohort of baby boomers — the sixties generation — were invariably left-wing. After all, as political scientist Rod Tiffen reminds us, “although John Howard may have been born among the people who became the flower-child generation of the sixties, it’s much more likely he was attending a meeting of the Young Fogies Society than dropping out on a hippie commune.” Tiffen nevertheless accepts the broad proposition that “different age groups tend to have distinctive outlooks.”
Despite all these difficulties, can we draw any conclusions about whether a baby boomer bulge, moving through the years, has shifted politics towards the left and away from the conservatives? On Chart 1, a fall in Coalition support among those in their forties and fifties is certainly evident when we compare the early 1990s with a decade later. But that chart has certain limitations. By the mid to late 2000s, the sixties generation — baby boomers born in the 1940s — were entering their sixties, at which point they are swallowed up in the data by the “Howard seniors,” who still dominated the ranks of the retired population.
Fortunately, the recent opinion poll data — from 2004 onward — provides an additional age bracket: sixty to sixty-four years of age. Using these data, Chart 2 allows us to track the baby boomers as they move into their sixties. Across all years — from 2004 through to 2016 — those voters aged sixty-five and over continued to solidly support the Coalition, but those in their late fifties and early sixties steadily jumped ship. By 2016, those in their early sixties were barely on the Coalition’s radar, and those in their fifties were long gone.
Chart 2: Voter support for the Liberal–National Party Coalition, 2004–16
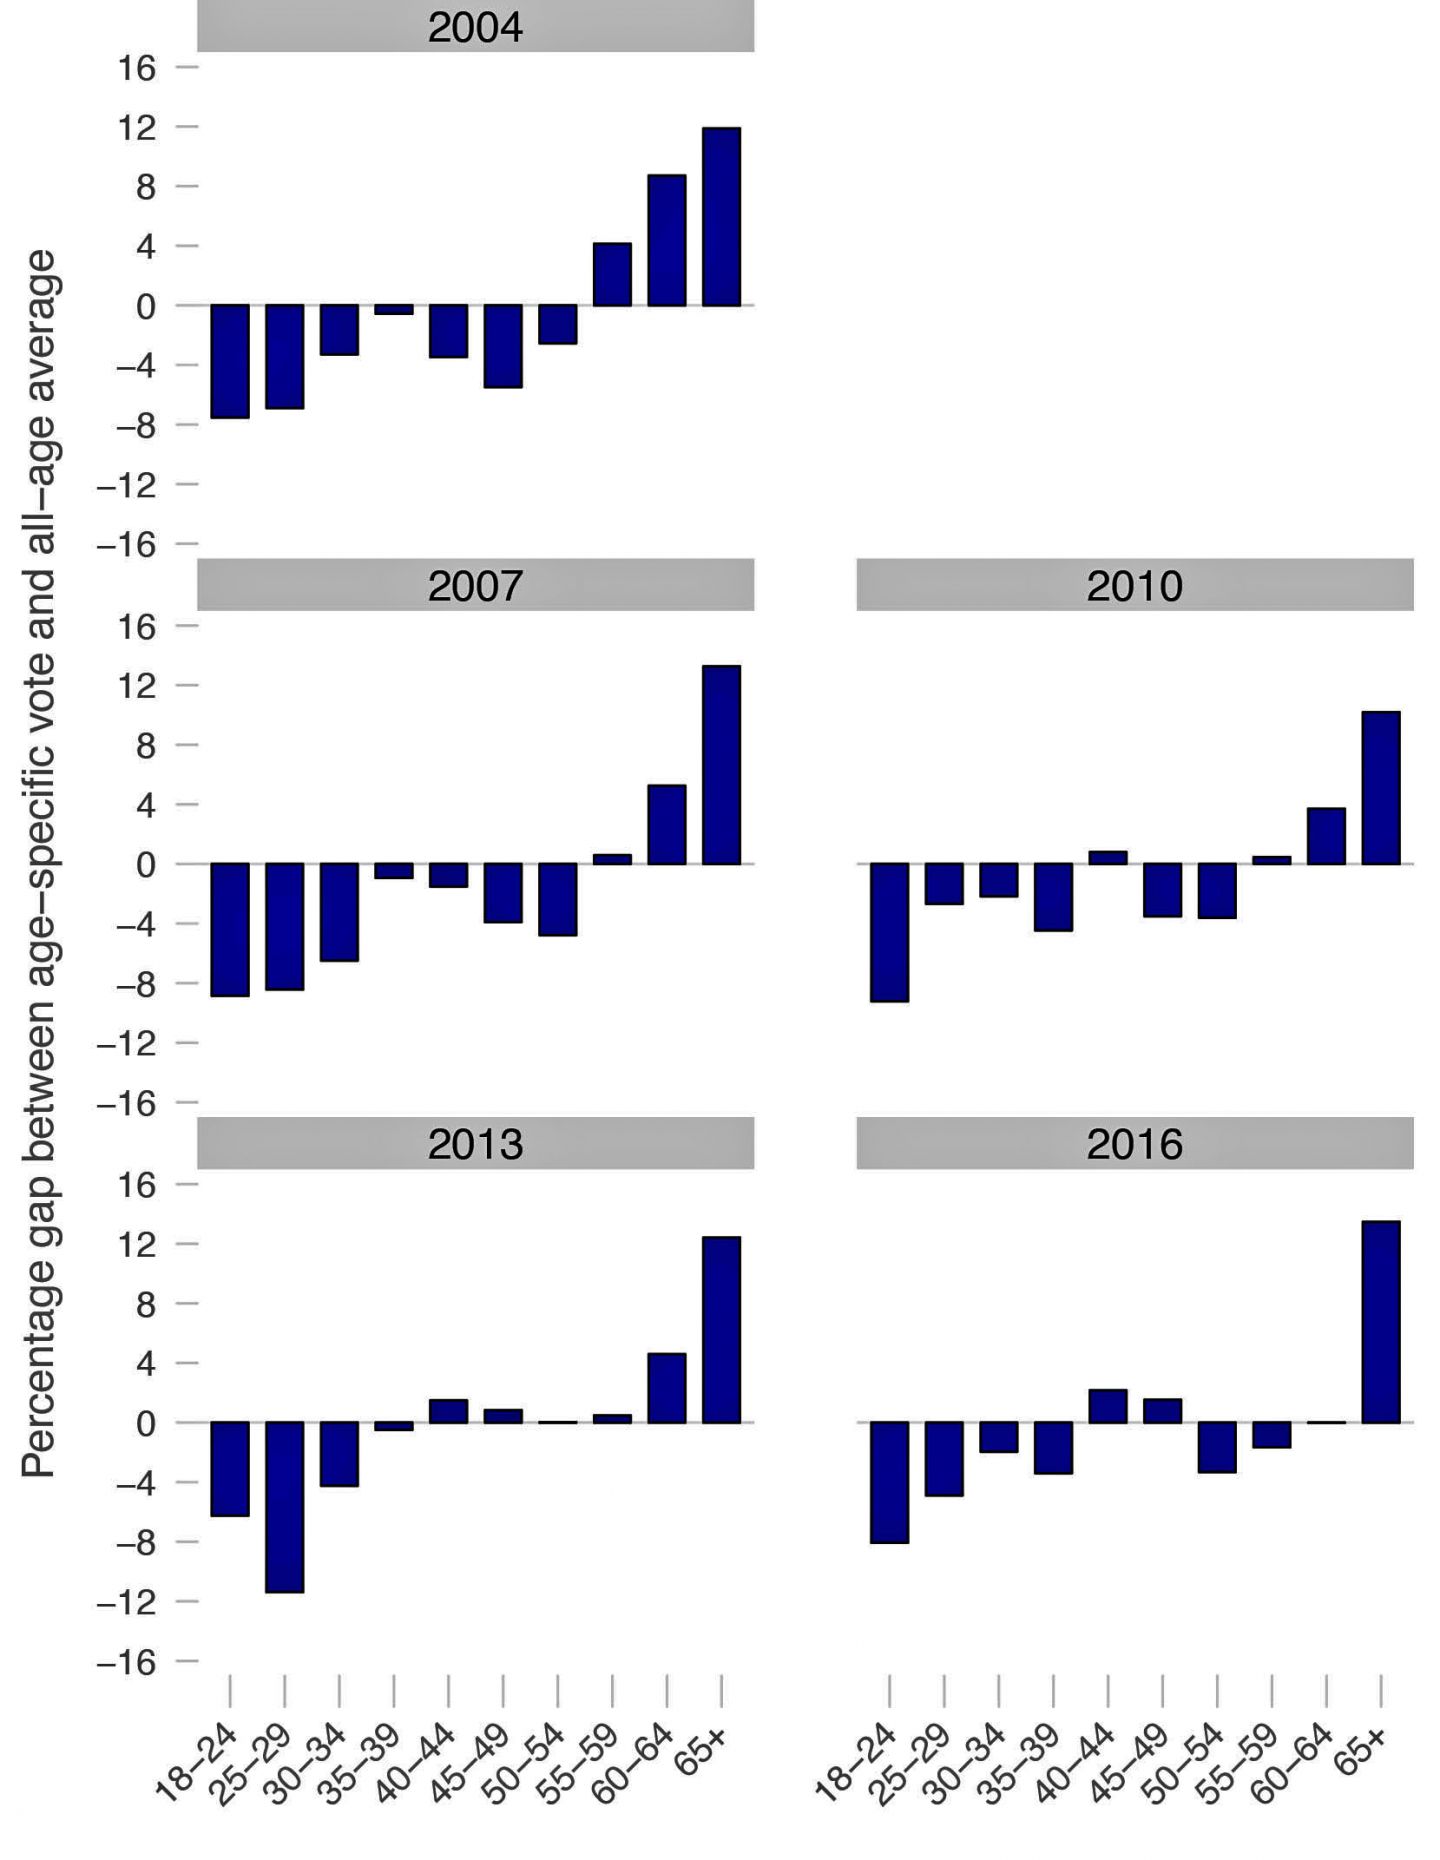
Source: Author’s calculations using Newspoll and Essential Research data. See technical note at the end of this article.
This demographic pattern seems fairly convincing, but is it a case of a more left-wing cohort gracelessly rejecting the Howard-Costello largesse? Are we seeing the 1960s hippies winning out over the young fogies? At this point, the lack of precision in these data — and the methodological challenges mentioned above — warrant caution. If you look at support for the Labor Party and the Greens (and in earlier years, the Democrats) using the same year and age-group tabulations, then an almost mirror image of Chart 1 emerges. Where the percentage gap is positive for the Coalition, it is negative for this “left combination,” and vice versa (see Chart 3).
Chart 3: Voter support for Labor and the Greens (and the Democrats), 1987–2016
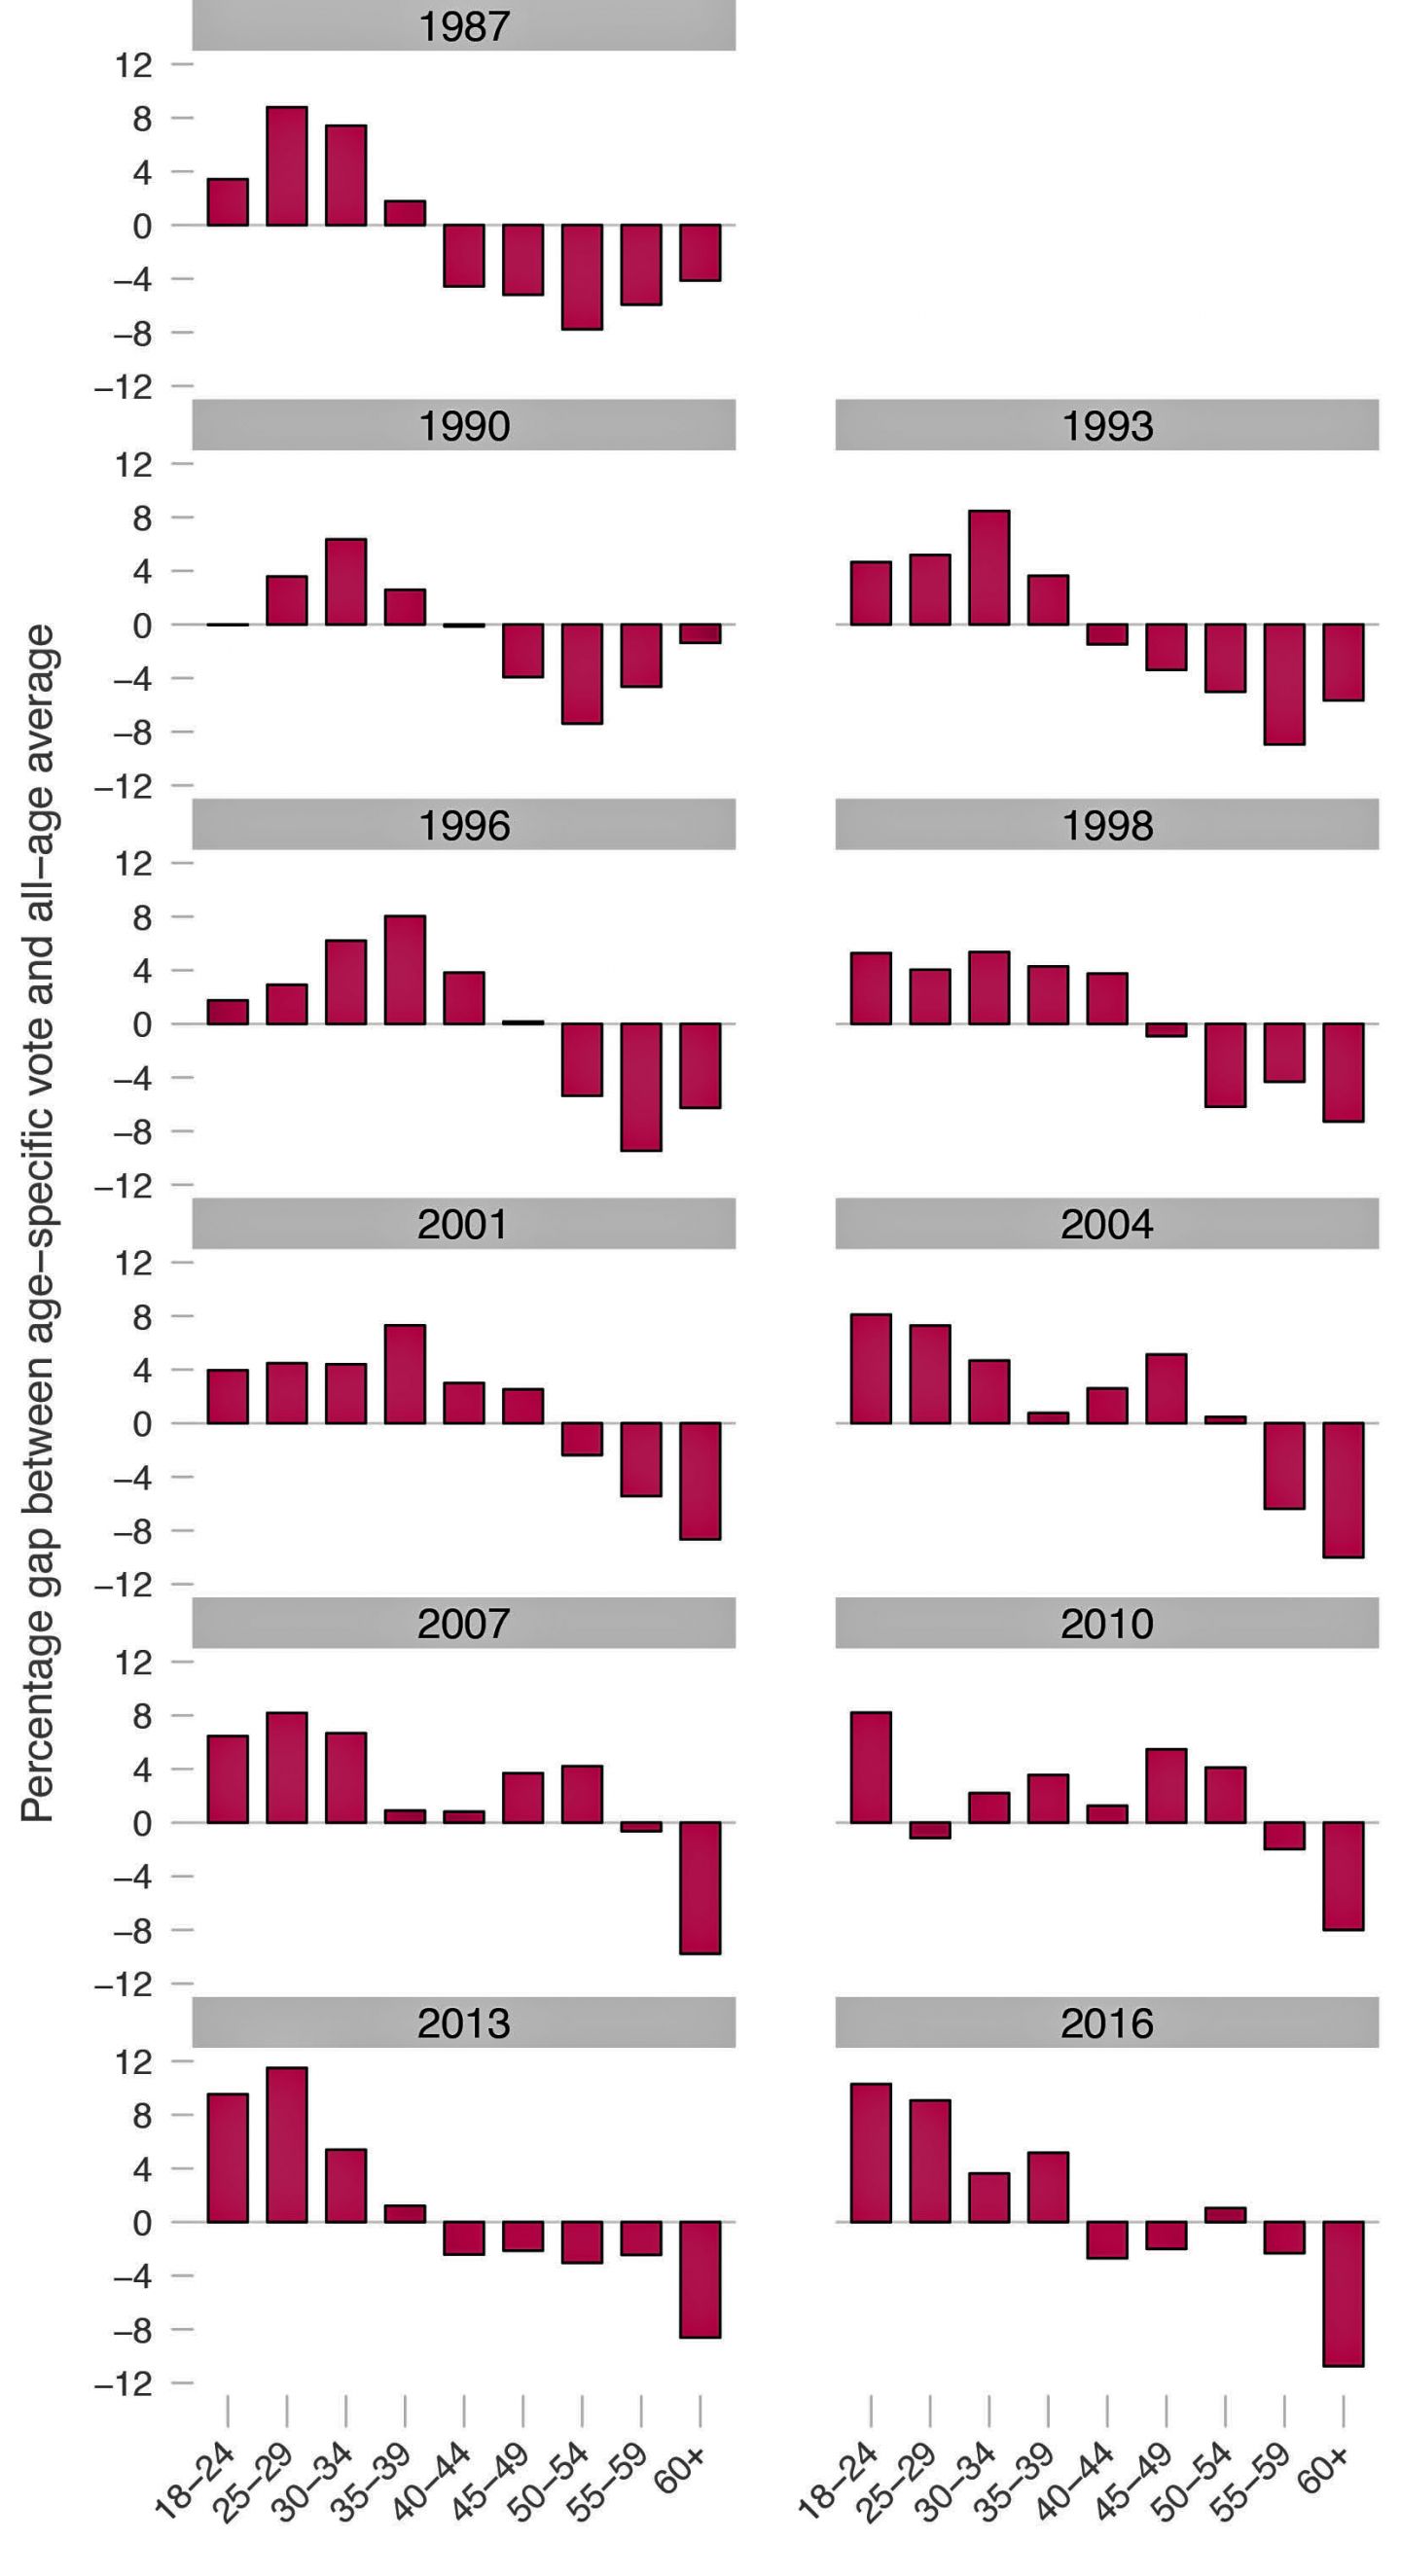
Source: Author’s calculations using Newspoll and Essential Research data. See technical note at the end of this article.
But the mirror image is far from perfect, particularly during the late 2000s. For example, if we look at the late baby boomers — those born in the early 1960s — the support for the Labor–Greens side of politics in recent years has weakened among those now aged in their late fifties. This particular age cohort seems to have deserted both the Coalition and the Labor–Greens combination. Their support has gone somewhere else.
What might be happening here? Of course, voters do have other alternatives to the Coalition and Labor–Greens. These are the micro0-parties and individuals that pollsters usually group together as “Other,” along with a miscellany of right-wing parties — including One Nation and the Palmer United Party — and independents and mavericks like Bob Katter.
In the Newspoll and Essential opinion data used for this article, the “Other” category is quite small, which means that tabulating age-related voting patterns isn’t feasible. But one insight into this question can be gleaned from the Australian Election Study, an ANU-based survey that asks respondents how they voted in the last election. These data show that in 2016, more than half of the voters who supported either One Nation, Palmer United Party or Katter’s Australia Party were aged over fifty. This is an age profile similar to that of Coalition supporters. By contrast, the age profiles for those who voted Labor or Greens are much younger (decidedly so for the Greens).
But this group of voters — the supporters of One Nation, Palmer United Party or Katter’s Australia Party — were not simply deserters from the Coalition. Indeed, they were just as likely to have voted Labor in the previous election in 2013 as to have voted Liberal.
In other words, the voting intentions of baby boomers turns out to be more complicated than at first glance. Certainly there is a long-term shift in support away from the Coalition as the population ages, suggesting that the “cohort effect” is more powerful than the “ageing effect.” But this hasn’t necessarily translated into gains for the Labor–Greens side of politics. Some of these baby boomers have gone elsewhere, primarily to the micro-parties and independents.
What might lie behind this trend? It is worth considering the other “effect” that can shape voting patterns over time: the period effect. The relevant period for today’s voters is characterised by considerable discontent. Since Brexit and Trump, it has almost become a cliché to point to a drift away from the mainstream, which in many cases becomes a lurch to the right. In Australia, the latest Fairfax–Ipsos Poll, taken in mid August, showed a sudden drop in the Coalition two-party-preferred vote from 49 per cent to 45 per cent, which triggered leadership challenges later in that week and culminated in the departure of Malcolm Turnbull from the prime ministership.
More revealing was the primary vote: Labor and the Greens barely shifted from their long-term average, while the vote for “Others” jumped from 15 per cent to 19 per cent. At the last election it was just 13 per cent. At that election, in July 2016, the Coalition primary vote was at 42 per cent, but the August Fairfax–Ipsos poll had the Coalition scoring a primary vote of just 33 per cent. Hence the leadership turmoil.
By itself, the voting-intention data discussed in this article is not sufficient to fathom discontent among baby boomers. But the age patterns in these data are consistent with the Brexit–Trump story. It is no coincidence that economic restructuring has often left some voters in their fifties and sixties high and dry. Discontent readily surfaces among those retrenched from blue-collar jobs, often in industries subjected to privatisation or severe cost cutting and the mass redundancies that usually ensued. Similar discontent can surface among voters in country towns where employment opportunities have dried up under the onslaughts of agribusiness and drought.
Even for those older voters not afflicted by economic restructuring, a certain nostalgia for what Australia “used to look like” has also played into the hands of the right-wing micro-parties. The parallels with recent developments in Europe — in Austria and now Sweden — come to mind. ●
I am grateful to both Newspoll and Essential for making the data available for this analysis. Thanks to Murray Goot, Peter Browne and Jan O’Leary for valuable feedback.
Technical note: All the charts use the data from Newspoll and Essential Research for the opinion polls leading up to each election in which respondents are asked for which party they intend to vote. The data are combined for all the polls in that year, providing large sample sizes of between 10,000 and 15,000 observations. This allows for the breakdown of the data into these age groups. The gap is calculated as the difference between the average voting intention of a particular age group and the all-age average. A positive percentage indicates greater support for that party in that age group, a negative percentage indicates the opposite.