How to Make the World Add Up: Ten Rules for Thinking Differently about Numbers
By Tim Harford | The Bridge Street Press | $32.99 | 352 pages
How well do you know the world around you? In recent years, pollster Ipsos MORI has been asking people questions about everything from sex to death in order to figure out how our perceptions square with reality.
On crime, the typical Australian thinks that 7 per cent of deaths are due to homicide (the true figure is 0.2 per cent), and 4 per cent to terrorism and conflict (the correct number is less than 0.1 per cent). Seventy-two per cent of Australians say that the murder rate is stable or rising; in fact, it’s dropped by one-third since the start of the century.
Australians think immigrants comprise 40 per cent of prisoners (the actual number is 19 per cent). We think that 18 per cent of teen girls give birth annually (it’s really 1 per cent). We think that 12 per cent of the population is Muslim (the correct figure is less than one-quarter of this). We think that 26 per cent of people live in rural Australia (the true share is 11 per cent).
In part, this could reflect a tendency to rattle off answers just to make the pollster go away. You don’t have to think too long to figure out that 18 per cent of teen girls giving birth each year would mean almost all women entering their twenties as mothers. But the statistical slip-ups are also a function of the news we consume. When was the last time you saw a Facebook meme about the fact that immigrants are, on average, less likely to commit crimes than other Australians? Or a front-page story about the falling homicide rate? Media coverage naturally skews towards the dramatic, and under-represents more common causes of death, such as cancer and heart disease.
If the affliction is numerical boo-boos, Tim Harford hopes to be the cure. Financial Times columnist, presenter of the popular BBC series More or Less, and author of a handful of bestselling books about economics, Harford writes with an engaging blend of fresh stories and unexpected facts.
How to Make the World Add Up begins with a look at Darrell Huff’s 1954 bestseller How to Lie With Statistics, a cynical polemic about how bad data and dodgy analysis can be used to swindle the unwary. If you’ve ever studied probability or econometrics at university, you may have had the experience of a mocking friend citing Huff as evidence that truth can’t be found in the numbers — that statistics exist to bamboozle, not enlighten.
Yet when evidence mounted of a statistical link between smoking and lung cancer, it was Huff who told a US Senate committee that the connection was fanciful. In fact, he said, the link between smoking and cancer was as spurious as the correlation between the number of storks in an area and the number of births. Huff not only suggested that the Senate ignore the statistical evidence, he was also working on a sequel to his bestseller, which he intended to call How to Lie With Smoking Statistics. (It was never published.)
From this story comes the nub of Harford’s argument: that we need to engage with statistical evidence rather than reject it as a sophisticated form of hocus-pocus. Holding a few key facts in your head, he says, will help give a sense of the magnitude of any new numbers you might discover.
For example, you might bear in mind that Australia’s population is about twenty-five million, that the annual output of the economy is about $2 trillion, and that the drive from Perth to Sydney is around 4000 kilometres. On average, about 5000 people a day leave their jobs, and about 5000 people a day start a new job. In recent years, daily job gains outnumbered losses, though this reversed savagely in 2020.
Armed with a few facts like these, it is easier not only to reject ludicrous claims but also to engage more confidently with what new research tells us about things like climate change, child wellbeing and clinical trials.
It also helps if we recognise that we tend to engage in “motivated reasoning.” Just as the referee always seems biased towards the opposing football team, people who have formed a view on a particular issue tend to reject contrary evidence. If you’re the kind of person who’s fearful about crime, you may skip over an article about falling assault rates but pore over an exposé about a recent burglary.
A striking example of motivated reasoning comes from the United States. A survey asked white evangelicals whether “an elected official who commits an immoral act in their personal life can still behave ethically and fulfil their duties in their public and professional life.” In 2011, 60 per cent said that personal and public morality go together. In 2018, the figure had fallen to 17 per cent. It turned out that when white evangelicals were thinking of Donald Trump, they were more forgiving of moral infractions than when they had been thinking of Bill Clinton. Their motivated reasoning showed that many put politics before religion when judging character.
How should we guard against the tendency to filter out inconvenient facts? By staying curious, says Harford. He quotes forecasting expert Philip Tetlock on the personality traits of “superforecasters,” those who are most accurate at predicting future events. For superforecasters, Tetlock argues, “beliefs are hypotheses to be tested, not treasures to be guarded.”
It turns out that curiosity can be found across the political spectrum, and curious people tend to be less politically polarised than their incurious counterparts. One way to engender curiosity, suggests Harford, is to respond to an angry polemic by asking the person to explain the details. Asked to expand on flat taxes, modern monetary theory or banning immigrants, a pompous partisan might become a little less cocksure.
Along the journey, How to Make the World Add Up makes a series of crucial observations about interpreting statistics. When it comes to surveys, size isn’t everything. After surveying over two million Americans in 1936, Literary Digest magazine confidently concluded that Republican Alfred Landon would defeat incumbent Democratic president Franklin Delano Roosevelt. Alas, Literary Digest failed to recognise that drawing survey lists from telephone directories and car registrations meant their results skewed towards the views of affluent voters. Roosevelt crushed Landon. A separate poll, conducted by Gallup, used a smaller but more representative sample, and predicted the correct result.
Not everyone likes to know the truth. After the Soviet Union’s 1937 census showed that the population was considerably smaller than expected (as a result of Stalin’s disastrous policies), the chief statistician was executed. In Argentina, government statisticians in the early 2000s were instructed to round down all decimals in the monthly inflation rate to the nearest whole number (turning 1.9 into 1, for example) as a means of cutting the officially reported annual inflation rate. In Tanzania, criticism of official statistics was made a criminal offence in 2018. In India, the government stopped publishing unemployment statistics in 2019.
Even in developed nations, a philosophy that government-collected numbers are “only for the important people” was pursued by the Thatcher government (which attempted to restrict the amount of data made freely available by the government statistician) and by those who fought against Australia’s MySchool reporting system (some of whom appeared to believe that parents had no right to know how their child’s school performed in nationwide tests in comparison with other schools). Harford not only argues for government statistics to be free and accessible, but also proposes that private companies be encouraged to provide de-identified datasets, much as firms disclose their inventions in exchange for patent protection.
With data increasing in volume by the minute, algorithms have great potential to improve our lives. But even there, we must be careful not to be misled. Based on internet searches, Google Flu Trends showed a remarkable ability to predict where the next flu surge would take place. A few years after it launched, though, it stopped working and was quietly retired. Perhaps, Harford suggests, Google Flu Trends was “part flu detector, part winter detector.”
Other algorithms also turned out to be flawed. An algorithm with an uncanny knack for identifying skin cancers turned out to be operating on a simple principle: if there was a ruler in the photograph, it likely depicted a skin cancer. A complicated secret algorithm that used 137 variables to predict whether an accused person would reoffend turned out to have less predictive power than a simple model using just a handful of variables. Google Photos mislabelled pictures of people with dark skin as gorillas. (The firm reacted by removing the ability of its algorithm to label anything a gorilla.)
In their embrace of data analytics, companies have occasionally overstepped the mark. A woman shopping online at the British retailer Tesco found herself being offered condoms and asked whether she wanted to “buy it again.” She and her husband didn’t use condoms, and it turned out that hubby had been playing around. In another instance, a man stormed into a Target store in Minneapolis, incensed that the store was sending special offers for baby clothes to his young daughter. It turned out that the daughter was indeed pregnant, a fact Target had gleaned from her purchase history.
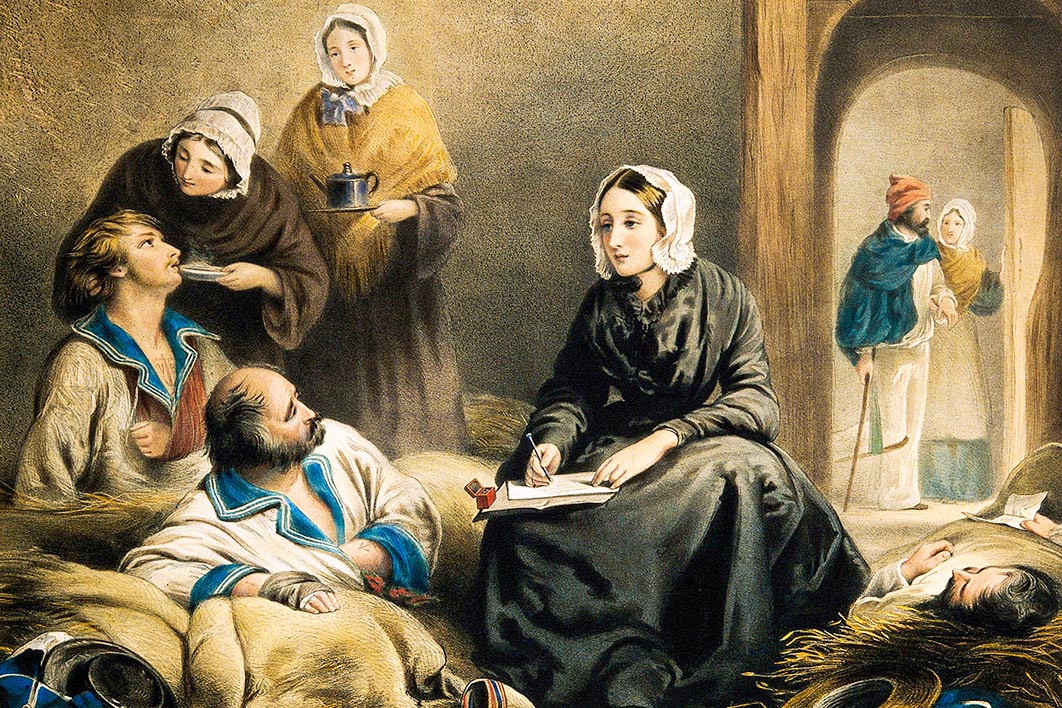
“Whenever I am infuriated, I revenge myself with a new diagram,” Florence Nightingale was reported to have written to a friend. As a health reformer, Nightingale knew the power of data to persuade those in power to make hospitals more hygienic, clean up rented homes, and reduce the spread of contagious diseases.
As the world reels in the face of a pandemic and a recession, societies rely on statistics to understand the spread of the virus, its economic effects, and the potential efficacy of vaccines. For anyone who wants to better understand the world around us, Tim Harford’s rollicking tale of statistical success and failure is tough to beat. •


