Something remarkable has happened in the Australian labour market over the past year. Employment in the manufacturing industry, having declined fairly steadily for more than forty years, has increased — or at least that’s what the latest Labour Force Survey, or LFS, from the Australian Bureau of Statistics suggests.
Chart 1 shows the pattern of employment in Australian manufacturing from 1966 onwards. After reaching a peak of 1.38 million in 1973, employment declined to 870,000 by 2017. But then came a turnaround, with a net addition of 85,000 employees in the past year.
Chart 1: People employed in manufacturing in Australia, August 1966 to August 2018 (Labour Force Survey original data)
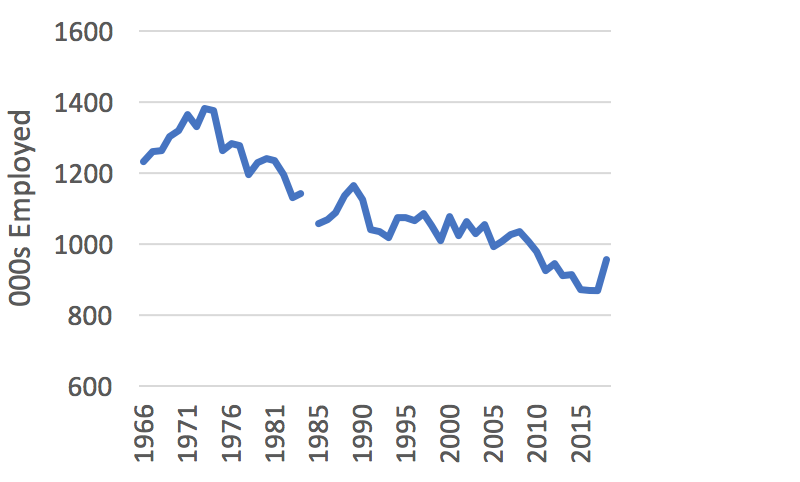
Note: The break between 1984 and 1985 reflects a change in official classifications.
Source: Australian Bureau of Statistics, Labour Force, Australia, Detailed, Quarterly, 6291.0.55.003, Table 04; Australian Bureau of Statistics, Labour Force Australia Historical Summary 1966 to 1984, 6204.0, Table 20.
The same pattern is evident when we look at manufacturing’s share of total employment in Australia. In 1966 it was 25.5 per cent. It declined to just 7.1 per cent by 2017, before rising to 7.6 per cent in 2018.
Chart 2 uses quarterly data to look in more detail at employment in manufacturing over the past decade. The growth in employment commenced in August 2017, and by August 2018 employment in manufacturing had returned to the same level as in November 2010.
Chart 2: People employed in manufacturing in Australia, third quarter 2008 to third quarter 2018 (Labour Force Survey trend)
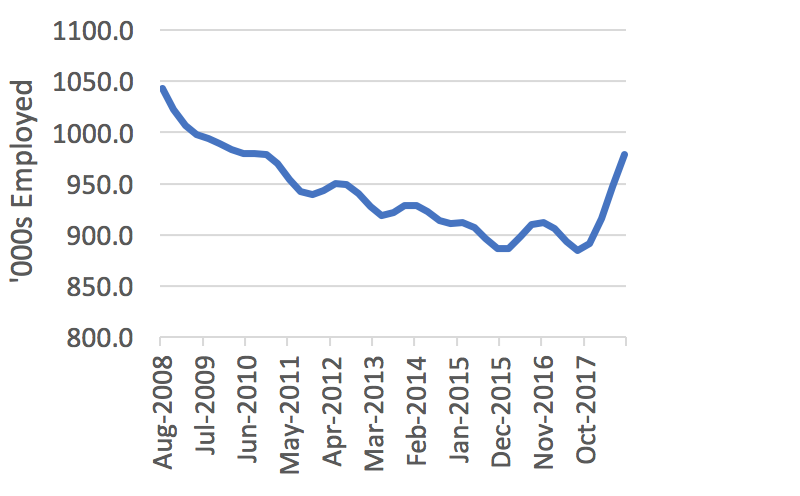
Source: Australian Bureau of Statistics, 6291.0.55.003, Table 04.
Before getting too carried away by a renaissance in manufacturing, though, a cautionary note is necessary. Figures from the new Australian Bureau of Statistics Labour Account don’t show the same jump in manufacturing employment. (According to the Bureau, the Labour Account uses “the macroeconomic framework and statistical techniques used in the Australian National Accounts to help address the inconsistencies, scope gaps, frequency and timeliness shortcomings of labour data drawn from a variety of business and household surveys and other administrative sources.”)
Chart 3 presents the numbers for employment in manufacturing from both series, the LFS and the Labour Account. For the period from the second quarter of 2017 to the second quarter of 2018, the LFS shows an increase in employment of 54,600 persons whereas the Labour Account reports just 7300.
Chart 3: People employed in manufacturing in Australia, third quarter 2008 to third quarter 2018 (Labour Force Survey and Labour Account trends)
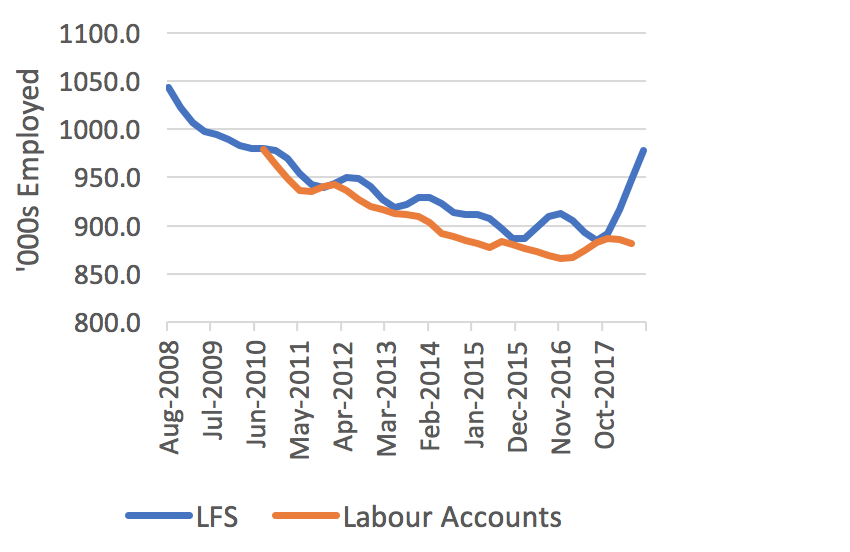
Source: Australian Bureau of Statistics, 6291.0.55.003, Table 04; Australian Bureau of Statistics, 6150.0.55.003, Table 4.1
But both series show similar increases in total employment over the same period — 335,100 in the LFS and 372,600 in the Labour Account. The implication is that increases in employment attributed to the manufacturing industry in the LFS are being attributed to other industries in the Labour Account.
Chart 4 shows the main industries where the two data sources differ in attributing employment growth between the second quarter of 2017 and the second quarter of 2018. Whereas the LFS attributes 16 per cent of the growth in total employment to the manufacturing industry, the Labour Account says it is only responsible for about 3 per cent. By contrast, construction, education and training, and administrative and support services explain much larger shares of the increase in total employment in the Labour Account than in the LFS.
Chart 4: Share of increase in total employment accounted for by selected industries, Australia, second quarter 2017 to second quarter 2018 (trend)
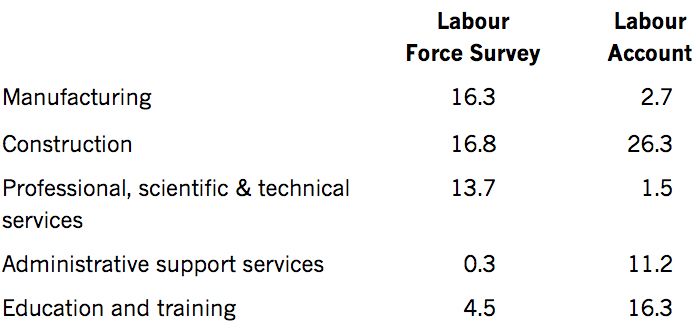
Source: Australian Bureau of Statistics, 6291.0.55.003, Table 04; Australian Bureau of Statistics, 6150.0.55.003, Tables 1–20.
Of the main two likely reasons for the difference, the first is sampling variability. “After adjusting for conceptual and scope differences between data sources,” says the Bureau, “a statistical discrepancy remains between the number of filled jobs as reported by businesses and the number of filled jobs as reported by households. These discrepancies represent the cumulative impact of data source error, including survey error, and modelling error.” It is unclear, however, whether sampling variability can explain such a large difference in manufacturing employment.
The other potential reason relates to differences in how employment is calculated at the industry level. In the Labour Account, “the number of employed persons is the sum of those holding main jobs in the industry, plus those holding secondary jobs after adjusting for double counting (i.e. for persons holding multiple jobs in the same industry).” The LFS only counts an individual’s primary job.
This means that the LFS and Labour Account would differ where there is a change in the number of workers who have a seconday job in that industry. On that basis, the different estimates of changes in manufacturing employment could be explained if, in the past twelve months, there was an increase in the number of workers whose main job is in manufacturing and an equal-sized decrease in the number of workers with a secondary job in manufacturing. But Labour Account data suggest little change in either series between 2017 and 2018.
In other words, these different estimates of the change in manufacturing employment between 2017 and 2018 are something of a puzzle at this stage. But they do suggest the need for caution in interpreting estimates from the LFS.
Changes in employment over the past twelve months have not been uniform across manufacturing industry sectors. Roughly speaking, two types of experiences can be identified. First, there are several sectors (see Chart 5) in which employment has rebounded in the past year after decreasing between 2008 and 2017. Second, there are other sectors in which employment has continued to decrease after 2017.
Chart 5: Rising and falling sectors: people employed (thousands) in Australian manufacturing industry, selected sectors and years (original data)
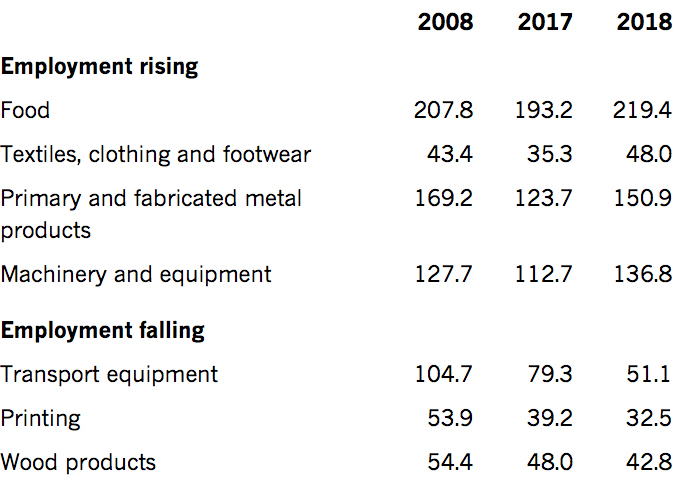
Source: Australian Bureau of Statistics, 6291.0.55.003, EQ06.
Finally, the story by state is also uneven. Employment has rebounded in the manufacturing industry in New South Wales, Queensland and Western Australia after 2017, but in Victoria, South Australia and Tasmania it has either continued to decrease or risen only minimally.
Much of these differences in state-level changes in manufacturing industry employment appear to be explained by the make-up of employment across states. What appears to differentiate Victoria most from New South Wales and Queensland is not an absence of growth in employment in sectors such as food, textiles, clothing and footwear, and machinery/metals production, but simply the much larger negative impact of decreases in employment in the transport equipment sector. South Australia has been adversely affected in the same way, and has not had the benefit of strong employment growth in the machinery/metal production sectors. •