In the broad picture, the 2016 census has confirmed things we already knew about ourselves. But burrow down into the detail, and you’ll find much that will surprise you.
The key themes are well-known. Australians are getting older: almost five million of us are now over sixty, and almost a million Australians are over eighty. We are becoming ethnically more diverse: more than six million Australians – more than one in four – were born overseas, and for the first time more of them come from Asia than from Europe.
Fewer of us own our homes (thank you, negative gearing!). Home ownership rates are now back to postwar levels, and housing densities in the big cities are rising as more people squeeze into existing homes. Fewer of us believe in God, and those who do worship in increasingly diverse forms: only 52 per cent identified themselves as Christians, 8 per cent belonged to other faiths – mainly Islam, Buddhism and Hinduism, in that order – while 30 per cent declared no religion and 10 per cent declined to answer.
Despite the NBN, and the way the internet has transformed the lives of most of us, the census found that almost 15 per cent of Australian homes still have no internet connection. While 25 per cent of households reported a combined household income of less than $800 a week, 15 per cent reported earning more than $3000 a week (and another 10 per cent provided incomplete information on incomes, or none at all).
While census questions about incomes are always subject to a high rate of non-compliance, those figures, and many other census details, map out a growing level of economic inequality in a country for which social equality has long been a trademark.
From the census data, the Bureau of Statistics has concluded that Australia has more people than it thought. More precisely, Victoria (Melbourne, that is) had 100,000 more people than previously thought, and is now estimated to have grown by 146,000 in 2016 alone. This means the city is adding more than 10,000 people a month, and Victoria – essentially Melbourne and the area within a 150 kilometre radius of it – is attracting almost 40 per cent of the nation’s population growth. The political and policy consequences are startling.
Politically, Victoria and the Australian Capital Territory will each get an extra seat in parliament because of their rapid growth (long overdue for the ACT, whose two existing seats have huge enrolments). The new ACT seat will certainly go to Labor, and the Victorian one probably so. On the other hand, Adelaide will lose a seat, and most Adelaide seats are Labor.
Had it happened earlier, Malcolm Turnbull might now be struggling with a minority government. The census figures have just made his chances of re-election a bit harder.
Turnbull and his team must now accept their responsibility to play a constructive role in helping to fill Melbourne’s need for new infrastructure. As I have written before, this government’s neglect is stunning. In 2017–18, on its own figures, it will spend or lend $1.7 billion to build new infrastructure in Sydney, but will provide only $193 million for new infrastructure in Melbourne, which now has to house and service more than a third of Australia’s population growth. This blatant bias is bad policy, and bad politics.
The mainstream media did a very good job of covering the census data, but inevitably it focused first on the overall numbers. In many ways, the most revealing things the census tells us are in the finer detail, or will come from matching one set of data with another. That will take time.
One of the surprises, for instance, was that the overall rate of home ownership in 2016 was not too much lower than a decade earlier. Of those answering the question, 67.1 per cent said they owned their home, down from 69.8 per cent a decade earlier. But there were limitations in the data supplied, which could mean that the census understates the shift.
For years, compliance in answering census questions has been in decline. In 1996, only 2.3 per cent of households skipped the question on housing tenure. Last year, 7.7 per cent of households answering the census form skipped that question (and many others). Can we assume that they have similar tenure patterns to those who did answer the question? Or is it likely that a higher proportion of those who don’t answer are renters? If so, the published figures understate the decline in ownership.
Also obscuring the problem is the fact that home ownership rises with age – and Australia is an ageing society. I’m burying the scoop somewhat, but detailed figures given to Inside Story by the Australian Bureau of Statistics show dramatic declines in home ownership by age group since negative gearing took off in the early 1980s.
Ownership in retreat: home owners by age group

Since 1981, the rate of home ownership among twenty-five to thirty-four year olds has crashed from 61 per cent to 45 per cent. (Figures for past census years come from a submission by Sydney University’s respected housing expert Judith Yates to the parliamentary inquiry into home ownership led by Liberal MP John Alexander. The inquiry was cynically terminated by the Coalition before the independently minded Alexander could file a report, then reconstituted under the more compliant David Coleman, who duly reported that if there are any problems with housing affordability, state governments are to blame.)
Okay, we know that many of today’s young are big spenders on their phones, overseas holidays and weddings, and don’t prioritise home ownership as their parents did; but other young people do want to own their own homes, save as hard as they can, only to find the market out of their reach. Even among thirty-five to forty-four year olds, the rate of home ownership has fallen from 75 per cent in 1981 to 62 per cent in 2016.
To put it another way, those without their own home at the age of forty or so have risen from 25 per cent to 38 per cent of Australians that age.
It has happened because of a bipartisan policy, until recently, to reduce home ownership by allowing tax breaks for rental investors. As treasurers, Joe Hockey and Scott Morrison tried to get the Coalition to reduce or remove these tax breaks, without success – probably because so many Coalition MPs and senators are themselves taking advantage of this rort. Chris Bowen has been more successful in getting Labor to reverse its policy, which gives us a clear choice between the two parties: one of them now sides with the investors, the other with aspiring home owners.
The census found that in the past decade, the slump in home ownership has spread to higher age groups. This time, 28 per cent of households headed by forty-five- to fifty-four-year-olds were without a home they owned, as against 22 per cent a decade earlier. Future budgets will face serious costs if they have to subsidise the rental bills of millions of retirees, rather than the few hundred thousand receiving rental support now.
The bottom line from the census is that different Australias are changing at very different paces. Some changes are sweeping right across the nation; others are confined to the big cities, and especially to the inner areas of them. It’s worth burrowing down into the detail to discover what’s really going on where.
Let’s look at the data for three federal electorates. All are in Victoria, but in different areas, and the changes there reflect those happening in every state of Australia.
Melbourne is the only federal electorate held by the Greens, and it’s at the epicentre of the rapid remaking of Australia’s inner cities. In the established outer eastern suburbs lies Aston, which has seen, by contrast, the biggest swing to the Liberals anywhere in Victoria over the past thirty years, changing it from a marginal Labor seat to a safe Liberal one. And far away in the Western District is Wannon, once represented by Malcolm Fraser, which today seems as remote from social and economic change as any place in Australia.
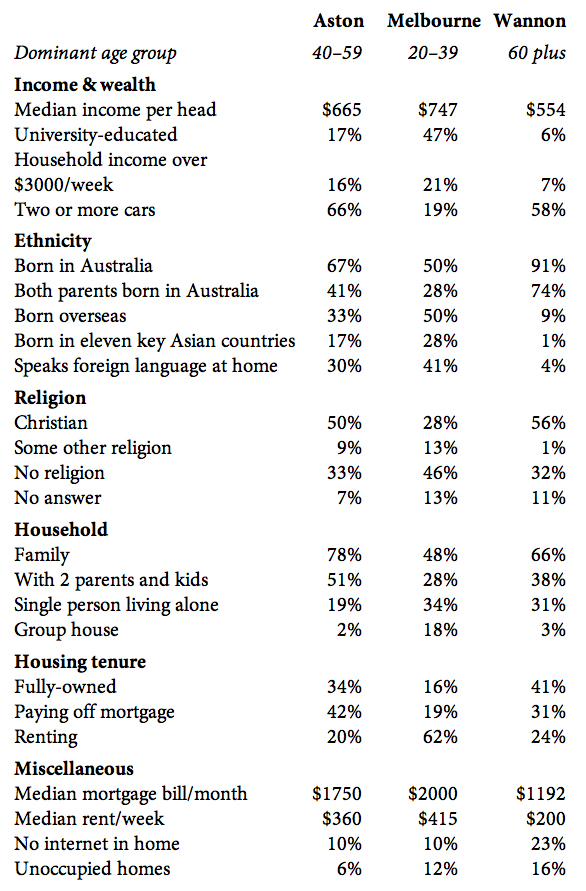
The Census, as told by three electorates
The massive increase in Victoria’s population – in a decade, it’s swollen by 1.14 million or 22.3 per cent – has increased the average enrolment in its electorates by 15.5 per cent since the 2010 redistribution. A third of that has gone into just five electorates, all held by Labor or the Greens: four on the outer suburban fringe, and Melbourne. The census counted 136,018 people living in Aston, 133,772 people in Wannon, and 208,593 in Melbourne, which now has the biggest population of any of the 150 federal electorates.
Since the 2010 redistribution, Melbourne has added another 52,767 people, whereas Wannon has added just 8415 and Aston 6568. Inner Melbourne can absorb that number because many of them are students, and new jobs are constantly springing up for workers. The inner city is a dynamic region: if you live there, the world around you is changing constantly, and that influences your values. If you live in a settled outer suburb or country town with little population growth, the world around you isn’t changing much, and that too influences your values.
In the three statistical regions covering Wannon, meanwhile, the census found population growth of just 2600 over the past decade. By 2016, in round figures, it had 4500 fewer children and teenagers than a decade earlier, and 3200 fewer people of prime working age – but 10,300 more people at or nearing retirement age. The next census might well record more retirees than workers, because few jobs are being created there and many of the young are migrating. That was why the Andrews government had to swallow its principles and agree to a new subsidy for Alcoa’s Portland smelter, to keep one of the area’s biggest employers.
Victoria is seen as an economic success story, but if you dig into the figures, that success is concentrated in Melbourne, and particularly in inner Melbourne. The Bureau of Statistics estimates that in the past three years, 95.5 per cent of all growth in full-time jobs in the state has been in Melbourne. In net terms, only 4.5 per cent of new full-time jobs are in the regions. In the country, six in every seven new jobs created are part-time. That’s why the kids move out, and head to the city.
In recent days the Age has shone its investigative spotlight on the problems of a city (and to some extent, a nation) that seems to be relying on population growth and housing construction to drive its economy. While the series made too much of the Bureau’s unreliable measures of state output, and let the Turnbull government off lightly, it did a fine job of highlighting the gap between the city’s breakneck population growth and the modest investments in infrastructure, and the lack of jobs, services and infrastructure in the outer suburbs that still take a narrow majority of Melbourne’s population growth.
The census confirms that, essentially, immigration is driving Victoria’s economy. In the electorate of Melbourne, 50.3 per cent of those who gave their birthplace were born in Australia, while 49.7 per cent were born overseas, including 11.1 per cent in China alone, and a similar number in ASEAN countries such as Malaysia. That probably understates the reality, since one in ten census respondents didn’t answer the question.
Even twenty-five kilometres away in suburban Aston, centred on Knox at the foot of the Dandenongs, a third of residents were born overseas. Of them, though, one in four was from the white English-speaking world (what I call “the Anglo crew”), and the rest were from a wide range of countries, including an outsize share from Sri Lanka. In fact, one in forty of Aston’s residents comes from that island, part of a large community that started settling in Melbourne in the 1960s and is now 54,000 strong.
But in the far west of Victoria, hardly any Asian migration has reached Wannon. The census found only 8.7 per cent of its residents were born overseas, and most were from Britain, New Zealand and other Anglo countries. The biggest contingent among the non-English-speaking countries were the 597 residents who had migrated from the Netherlands, most of them at least fifty years ago.
Malcolm Fraser opened Australia to Vietnamese refugees, yet forty years later, only sixty-nine Vietnamese-born people live in his old electorate, compared with 5098 in the electorate of Melbourne. Wannon has just 261 residents born in China; the electorate of Melbourne has 20,739.
In Melbourne, 41 per cent of people said they spoke a language other than English at home; in Wannon, only 4 per cent did. In Melbourne, 13 per cent of residents were Buddhists, Muslims, Hindus and other minority faiths. In Wannon, only 1.4 per cent belong to non-Christian faiths. The difference is staggering.
Is it plausible to suggest that one reason for the polarisation of Australians’ attitudes to Muslims in general, and Muslim refugees in particular, is that people in some areas are used to them being in their neighbourhood, while people in other areas are not?
It is striking how what we are seeing now differs from the first wave of postwar migration in the 1940s and early 50s. That wave was led by the British, the Dutch and the Germans, who spread right across the country and put down roots wherever they settled. Even now, the 2016 census finds that in New South Wales, 34 per cent of the British-born live outside Sydney, as do 37 per cent of Germans and 44 per cent of the Dutch. Stunningly, so do 44 per cent of the Australian-born. In Victoria, the numbers are lower, but the pattern is similar.
But the second wave of migrants that followed, dominated by the Italians and Greeks, were more likely to form urban enclaves in the big cities. In Victoria, which attracted the largest share, only 10 per cent of Italian migrants and 3.4 per cent of Greeks now live outside Melbourne, much the same as a generation ago.
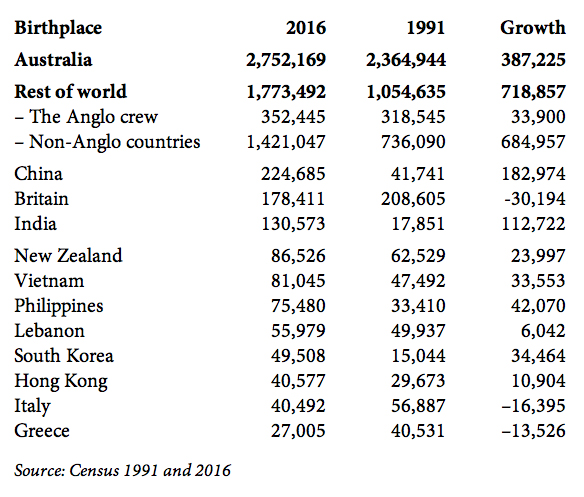
And the third wave of migration we are seeing now is almost completely city-centric. In Sydney on census night, the 224,685 Chinese migrants clearly outnumbered the 178,411 British – probably the first time in Australian history that British migrants have ever been outnumbered by another race in any capital city. But in the rest of New South Wales, with its 2.65 million people, the census found just 9578 Chinese migrants. Only 4.2 per cent of those in New South Wales live outside Sydney.
Sydney is also home to 96.3 per cent of the state’s Vietnamese-born population, 97.4 per cent of its Iraqi migrants, and 97.6 per cent of its Lebanese. That’s so different from the first wave of Lebanese migration a century or more ago, which spread out all over Australia, with some enterprising migrants buying horse and cart, fitting them out, and riding from station to station as the general stores of the outback.
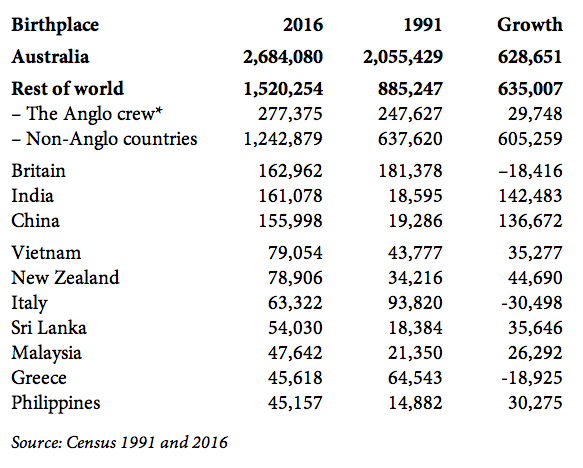
Migrants to Victoria are similarly concentrated in Melbourne. The few square kilometres ruled by the Melbourne City Council house four and a half times as many Chinese-born residents as the 210,000 square kilometres of regional Victoria, which include cities like Geelong, Ballarat and Bendigo. Melbourne is home to 97.2 per cent of Victoria’s Chinese migrants, 96.8 per cent of its Sri Lankans, 94.9 per cent of its booming Indian-born population, and 98.0 per cent of its Vietnamese.
Sydney now – and twenty-five years ago
Melbourne now – and twenty-five years ago
The one group of Asian migrants that has spread across Australia are the Filipinos. Barely half of them have settled in Sydney and Melbourne, and the rest have gone everywhere – maybe because they speak better English and can find work more readily, who knows? They are easily the biggest Asian community in Wannon, and you will find more Filipinos than Chinese across regional Australia.
Migrants usually flock to the cities. It’s natural that newcomers go where they have friends or family. But what we are seeing now is that natural tendency carried to extreme lengths. The difference between the racial makeup of electorates such as Melbourne and Wannon is like a difference between countries, rather than between parts of one region. Their human makeups have little in common. It’s not surprising that their political views also have little in common.
There are many other points of difference between these three electorates. Incomes, mortgages and rents are all highest in Melbourne, lowest in Wannon. The concentration of families is highest in Aston, whereas most households in Melbourne are either one-person flats or group houses. Almost half the residents of Melbourne have a university education; in Wannon, just one in seventeen people has been to university. And even in 2016, 23 per cent of occupied homes in Wannon have no internet connection.
The census also found that one in six homes in Wannon was unoccupied: more than anything, this reflects the decades of relative stagnation that has seen farms consolidate, villages die away and smaller towns shrink as the young migrate to bigger places. Footy grounds decay for lack of enough youngish men to field a team. A lot of western Victoria is going through that decline.
Even in Aston, 6.2 per cent of homes were unoccupied. In the city of Melbourne, a stunning 14.6 per cent of homes were declared empty by the census collectors; in neighbouring Port Phillip and Stonnington, the vacancy rate was almost as high. It adds to the case for a serious government-led stocktake of vacant housing, and the reasons for it. It’s a similar story in Sydney.
But the census did find one trend happening right across the nation, and at surprisingly similar rates: Australia is losing its religion. This is not so much because migration has brought growing numbers of Muslims, Hindus and Buddhists; their collective share of our people has grown from 2.6 per cent in 1991 to 8.2 per cent, but their numbers remain relatively small: the number of Muslims in Australia (604,240) is similar to the number of Presbyterians, and less than one-in-forty of the population.
The big increase has been in the number openly declaring that they have no religion. From 12.9 per cent a generation ago, that has soared to 30.1 per cent in the latest census, while another 9.6 per cent ignored the question. The Bureau of Statistics tells us that 75 per cent of all marriages in 2015 were carried out by civil celebrants; only brides and grooms born in the Middle East preferred to have a religious ceremony.
Even an ageing, conservative area like Wannon is experiencing that change. Apart from the lack of Muslims, Buddhists and Hindus, its census responses reflected the nation. The census found that, by state, the highest proportion of non-believers was in Tasmania, the nation’s oldest and most Anglo society, where 37.8 per cent said they had no religion, compared with just 25.1 per cent in New South Wales, which has by far the highest concentration of East Asian and Middle Eastern migrants.
Carrying out a census is an expression of national unity. But its results in many areas highlight our national divisions. •