Preferences only began to play a central role in Australian elections after the emergence of the Democratic Labor Party in the 1950s. Before that, the preferential voting system had enabled the Liberals and the Country Party to exchange preferences — putting the two notionally separate conservative parties in a near-permanent coalition — but there had never been any doubt about how those preferences would flow. It was only with the DLP’s decision to weaponise preferences (to try to force Labor to the right) that the system’s full implications emerged.
It took some time for the role of preferences to be properly understood. In David Williamson’s classic play Don’s Party, set on the night of the 1969 election, the party-goers are excited by Labor’s lead on primary votes, only to realise, as the night wears on, that DLP preferences flowing to the government are likely to produce a narrow defeat.
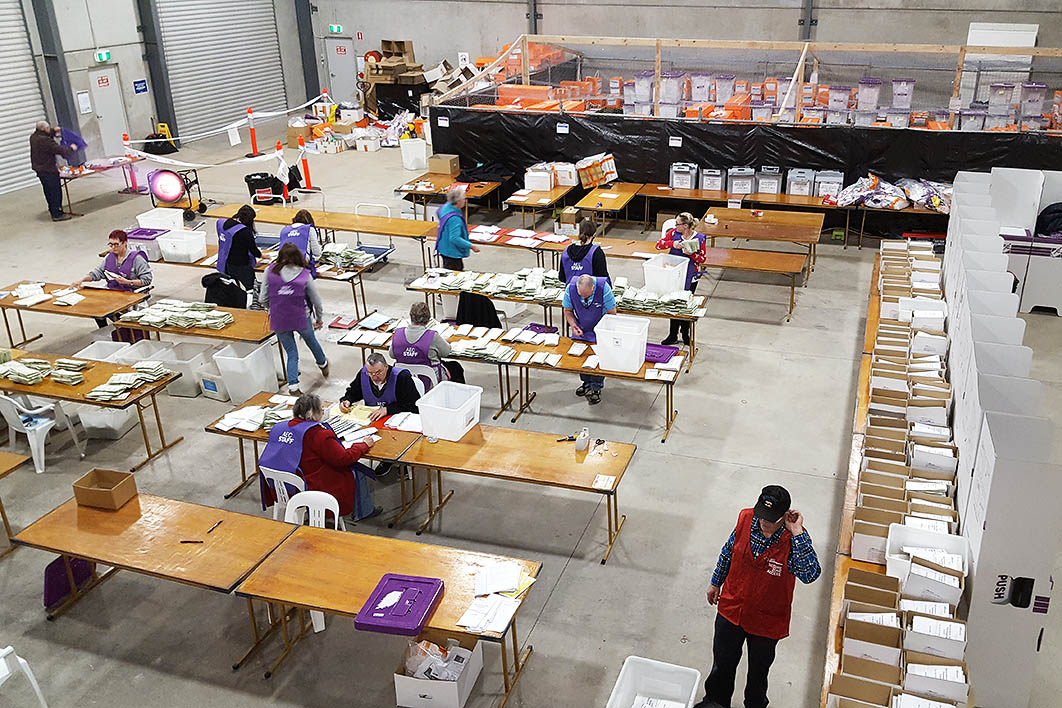
What made sense of this phenomenon was the idea of the “two-party-preferred vote,” or 2PP, which reflects the fact that minor-party candidates and independents are generally eliminated first when votes in each seat are counted. Their preferences are then distributed between the two major parties, the Liberal–National Coalition (treated as a single party for this purpose) and Labor, giving the 2PP result.
Broadly speaking, the party that receives a majority of the national 2PP vote is likely to win a majority of seats and therefore form government. That isn’t necessarily the case: one party can score narrow wins in a large number of seats while the other piles up large majorities in fewer seats. But effects of that kind are typically small. The biggest 2PP vote recorded by a losing party in recent history was Kim Beazley’s 51 per cent in 1998.
Opinion polls attempt to estimate the 2PP vote either by using historical preference flows or by asking respondents which of the two parties they prefer. Notably, Newspoll recently adopted the assumption that Clive Palmer’s deal with the government would deliver 60 per cent of his preferences, a decision was almost entirely responsible for the “tightening” of the margin that was trumpeted when the first poll using this flow was released.
What no one seems to have noticed is that 2PP calculations are illuminating only if we assume that the final two candidates in any seat are those of the two major parties. But that doesn’t happen if an independent or minor party candidate finishes ahead of one of the major party candidates and is elected on that candidate’s preferences — as Kerryn Phelps was in the recent Wentworth by-election.
Such a result, very rare in the twentieth century, is now becoming much more common. Independent or minor candidates have won seats in every federal election since 2010, and hold seats in every state lower house (counting those held by the WA Nationals, who refuse to form a coalition with the Liberals).
In these circumstances, the notion of a 2PP vote is meaningless. It might show which party would have won in a particular seat if the independent were not running, but that doesn’t help the party in question to form a majority government. Less obviously, the same is true in cases where the independent loses in the final round. Once again, the question of where their preferences might have gone is irrelevant.
Opinion polls don’t provide the seat-by-seat data that’s needed to undertake this exercise before an election. We can make a rough-and-ready adjustment by looking at the difference between the 2PP and two-candidate-preferred, or 2CP, votes at a previous election, then scale this difference to take account of changes in support for independents and third parties. I estimate that, for each of the major parties, the 2CP vote was about 0.5 per cent lower than the 2PP vote. That’s consistent with the outcome in 2016, when the LNP, with 50.4 per cent 2PP, scraped in with the barest possible majority, while Labor, on 49.5 per cent, fell well short.
This time it looks as if support for independents will be stronger, and will be concentrated in seats where there is a good chance of first or second place. On that basis, I’d suggest a reduction of one percentage point from the 2PP result recorded in the polls. These have been consistently close to 51–49 (arguably, too consistently given the random variation we would normally expect). Assuming the polls are correct, this would imply a knife-edge result, with Labor either gaining a bare majority or falling just short.
The seat of Mayo, won by Rebekha Sharkie in 2016 provides an example of how this would work at a seat level. While the 2PP vote went to the Liberals 56–44, the 2CP vote went to Sharkie, 58–43, a difference of 14 per cent. For completeness, it would be desirable to count the 2PP vote for Labor against Sharkie, which would have arisen if the Liberal candidate’s preferences were distributed. On the assumption that they would all have gone to Sharkie, the final vote would have split something like 75–25.
Although I have not undertaken a complete analysis, it seems likely that replacing the 2PP vote with the 2CP vote in every electorate where a major party candidate was eliminated would reduce the “preferred” vote for each of the major parties by one or two percentage points. Using the same reasoning we use in relation to the 2PP vote, we would expect a party to win a majority of seats in an election if, and only if, its 2CP vote was above 50 per cent. If neither party exceeds 50 per cent, we would expect a minority government.
How well does this predict observed outcomes in the period since third-party candidates became a major force? The 2010 election was very close, with Labor winning the 2PP vote 50.1–49.9. Clearly neither party would have had a majority of the 2CP count, so we would expect a minority government, which was the outcome. In 2013, the LNP won 53.5 per cent of the 2PP vote, implying well over 50 per cent of the 2CP vote and a majority government, as observed.
The 2CP model fared less well in 2016. The Coalition, with 50.4 per cent of the 2PP vote, almost certainly fell short of 50 per cent of the two-candidate vote, but won seventy-six seats, the narrowest possible majority. The outcome remained in doubt for over a week.
The current election will provide another test. Discussion of the polls has focused on the 2PP vote, which has, in recent polls, favoured Labor by 51–49. If this is unchanged on election day, it is likely that neither party will secure an absolute majority, but that Labor will have enough support to form a minority government.
Many political commentators will bewail the prospect of a “hung parliament.” But this is an outdated prejudice. Over the past twenty years, we have seen numerous parliaments with no lower house majority, and many with no upper house majority. Nearly all have run a full term. Few have produced the kind of electoral backlash experienced by majority state governments seen as unaccountable and/or corrupt. Indeed, as I have argued, it would be better to use the term deliberative parliament to contrast hung parliaments with the rubber-stamp lower houses seen as the norm. •
