With a few exceptions (including Andrew Leigh, Nicki Hutley and Angela Jackson) mainstream Australian economists — including me — haven’t thought, spoken or written as much about the causes and consequences of increasing inequality as perhaps we should have done.
International institutions including the IMF and the OECD — traditionally bastions of pro-market economic policies — have come to recognise that increasing inequality has adverse economic and political consequences. It has undoubtedly been a contributor to some of the uglier political developments over the past decade in the United States and Europe. And it has also been a factor in the increasing difficulty of building public support for (or even acceptance of) the sort of policies mainstream economists typically advocate in order to reverse the slide in Australian productivity growth — policies often widely seen as having contributed to increasing inequality.
By comparison with most other advanced economies, Australia has done a reasonably good job of preventing the distribution of income (as opposed to wealth) from becoming more unequal. Indeed, the share of total household income accruing to the top 1 per cent, or even the top 10 per cent, of households has actually declined over the past fifteen or so years after rising steadily from the early 1980s until the mid-2000s.
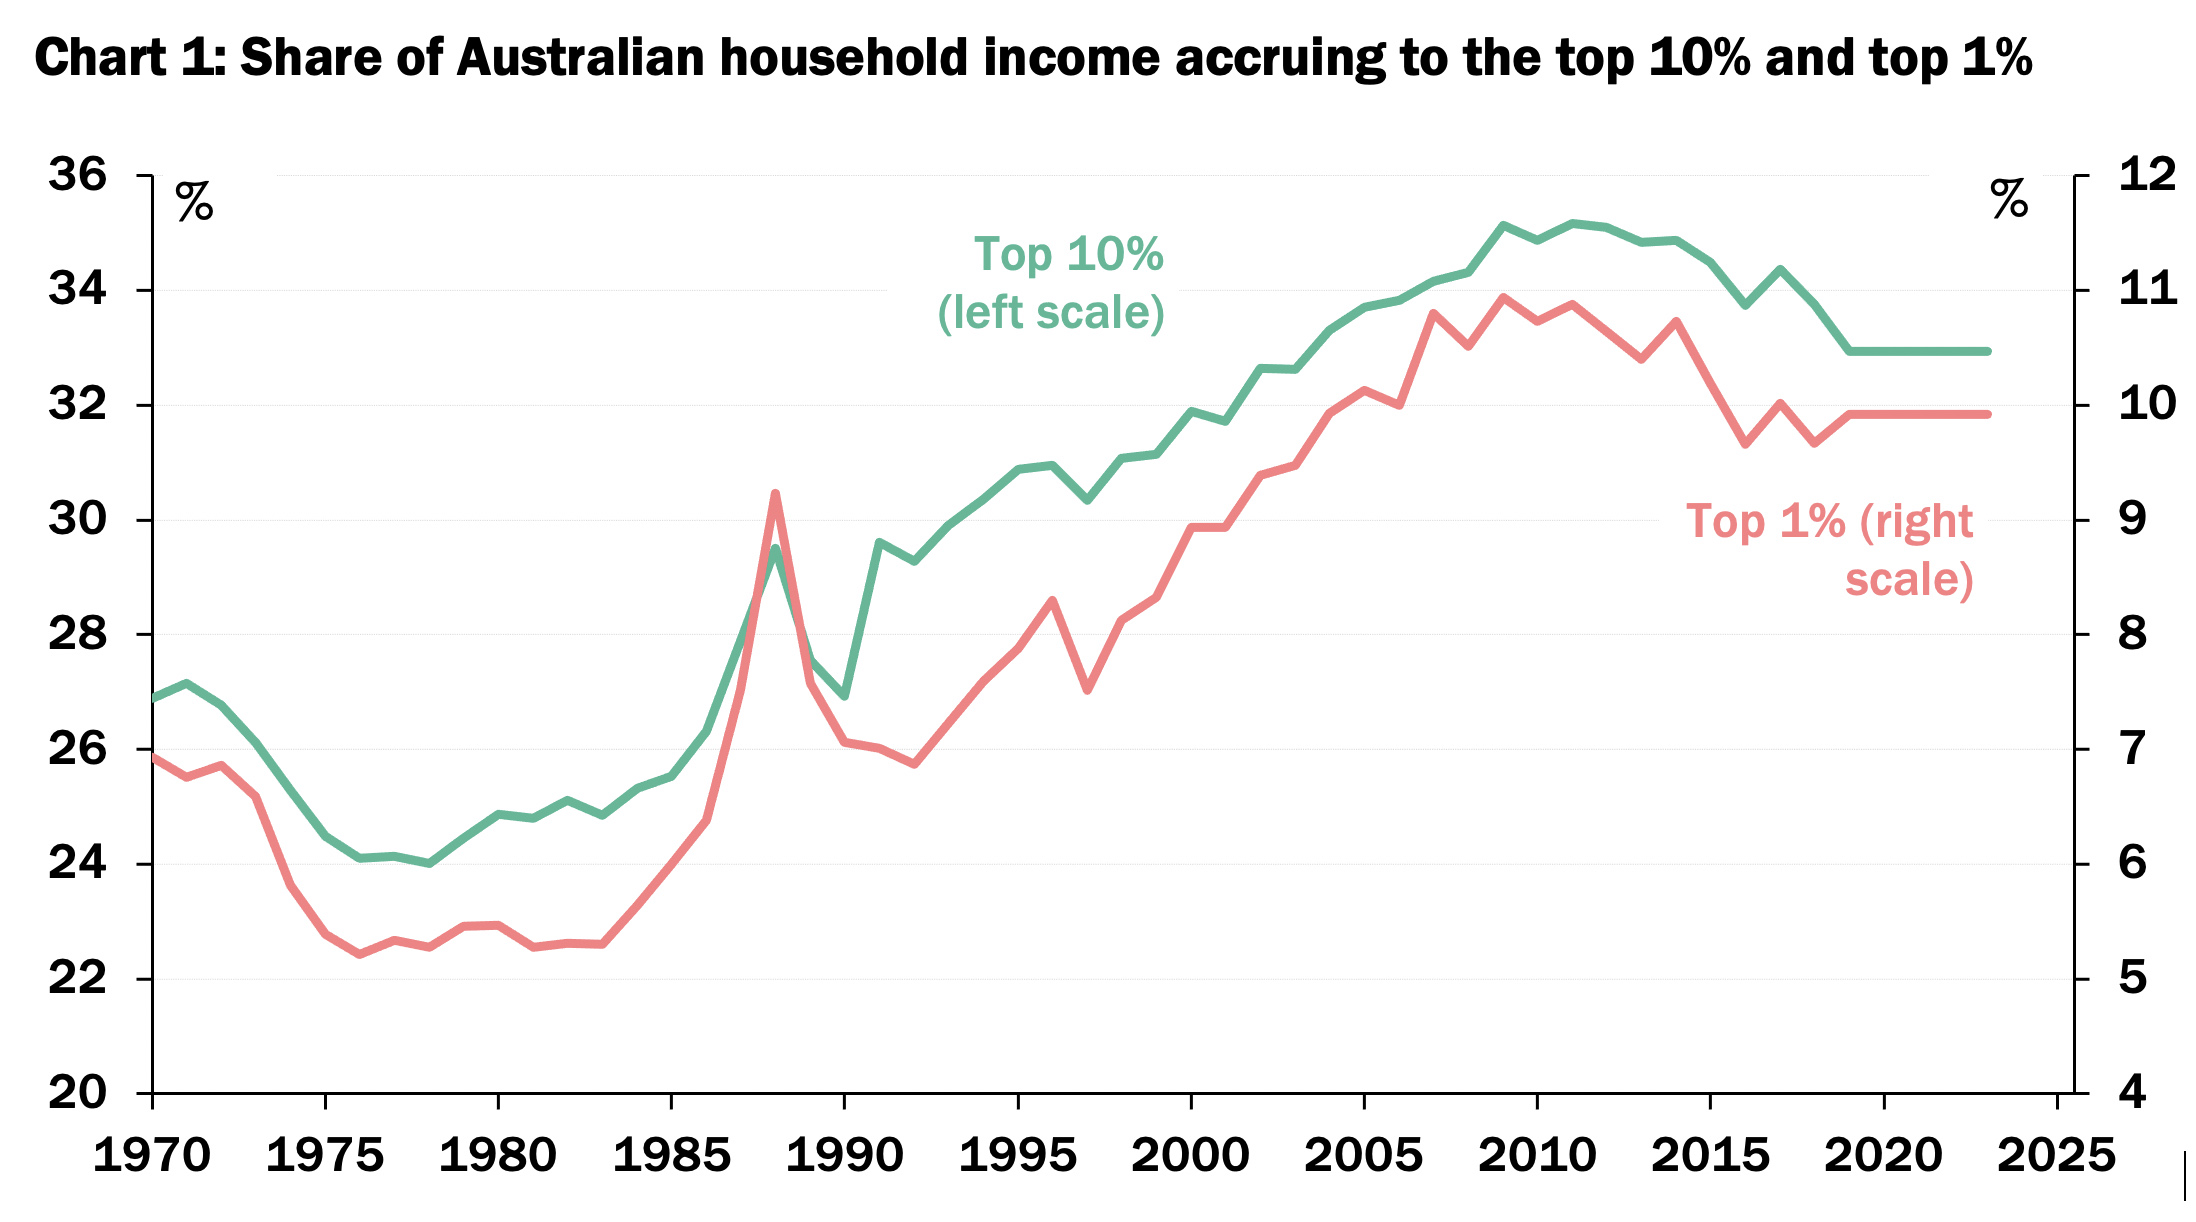
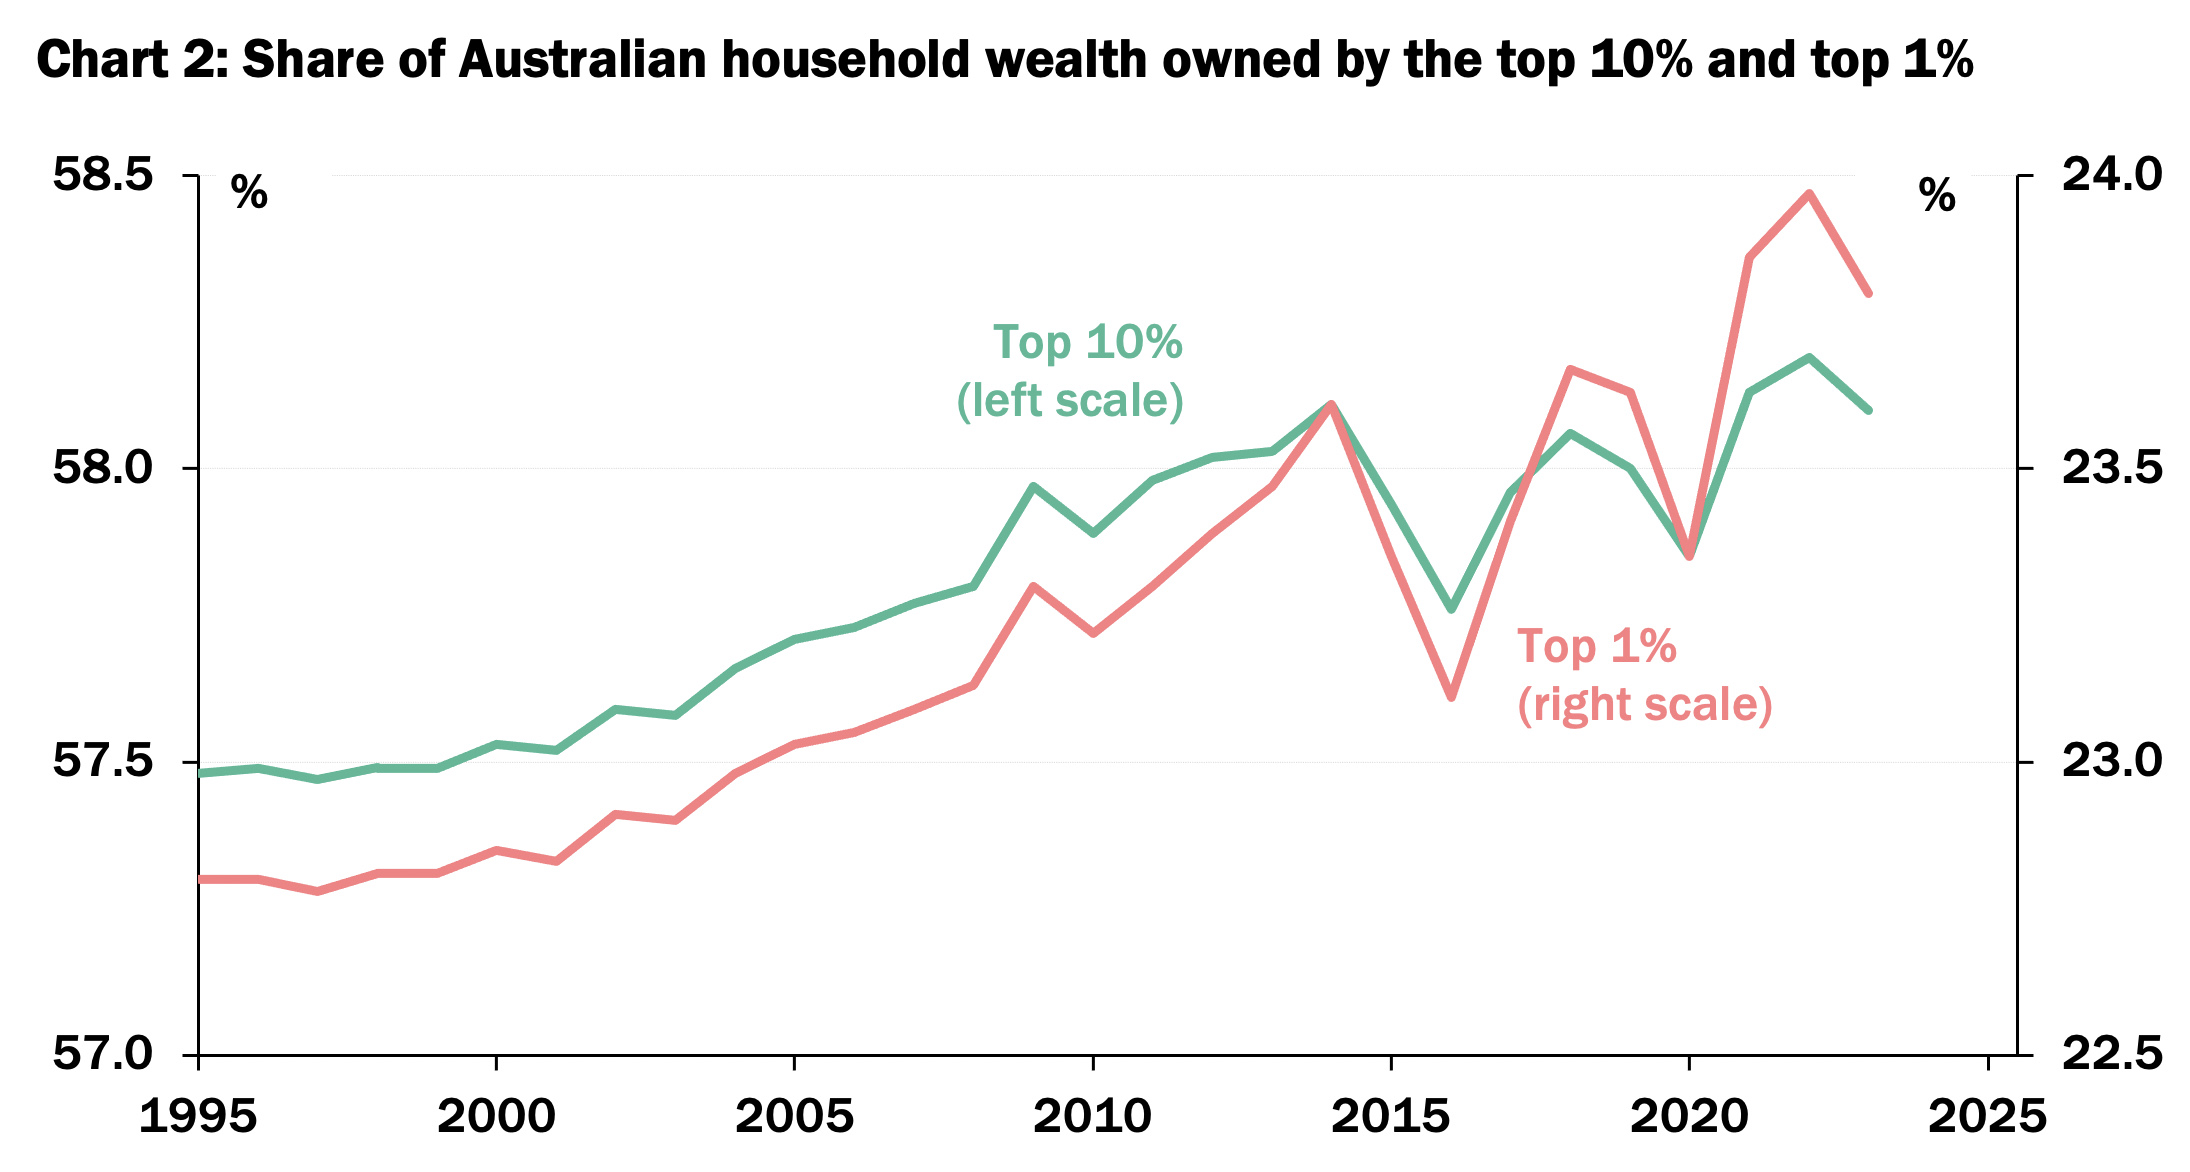
Source: World Inequality Database.
That’s in no small part because, as the ANU’s Peter Whiteford has long argued, Australia’s comparatively progressive taxation of income, its means-tested social security system and its relatively high minimum wages have done a good job, by international standards, of moderating the impact of global and domestic market forces tending to make the distribution of income more unequal.
The share of income accruing to both the top 1 per cent and top 10 per cent of Australian households is less than that in any other Anglo country — New Zealand, Canada, Britain or the United States — and less than in Spain, France, Germany or Japan. Indeed the top 1 per cent’s share of Australian household income is less than in ostensibly more egalitarian Sweden, according to the World Inequality Database.
But the distribution of wealth is not only much more unequal than that of income — in Australia as in every other country — but has become more so in Australia over the past three decades (apart from some temporary dips in the late 2010s and early 2020s), as shown in Chart 2.
Source: World Inequality Database.
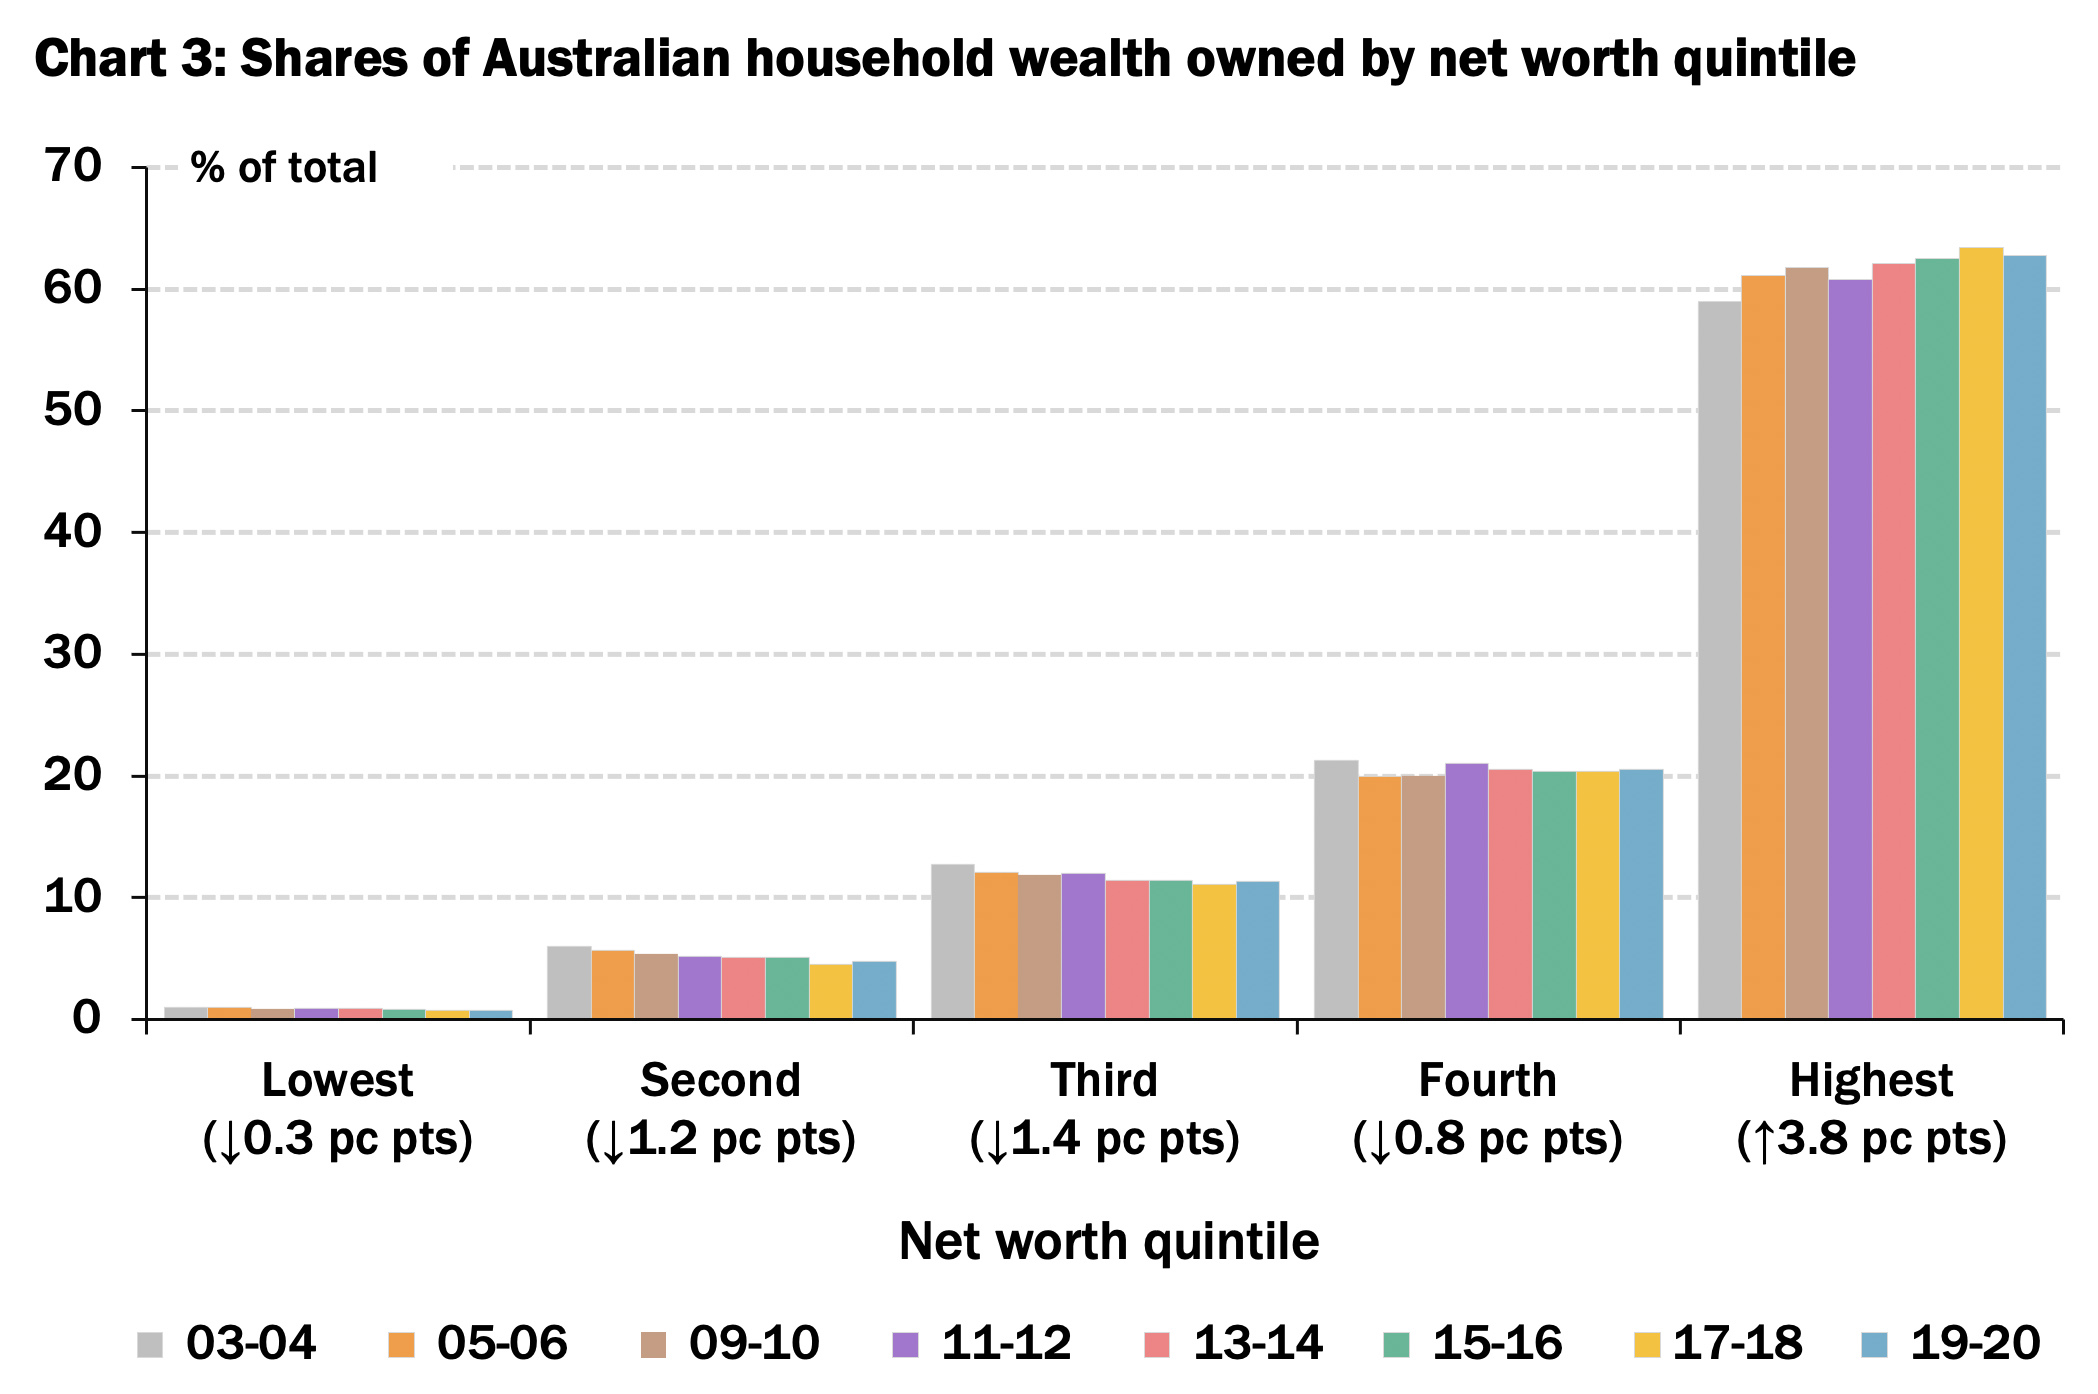
Data from the ABS’s Survey of Income and Housing — which is normally conducted every two years, though the latest was in 2019–20 — shows that the share of “total household net worth” owned by the top “quintile” (20 per cent) of households rose from 59.0 per cent in 2003–04 to 62.8 per cent in 2019–20, or 3.8 percentage points, while the shares owned by the other four quintiles all declined (see Chart 3).
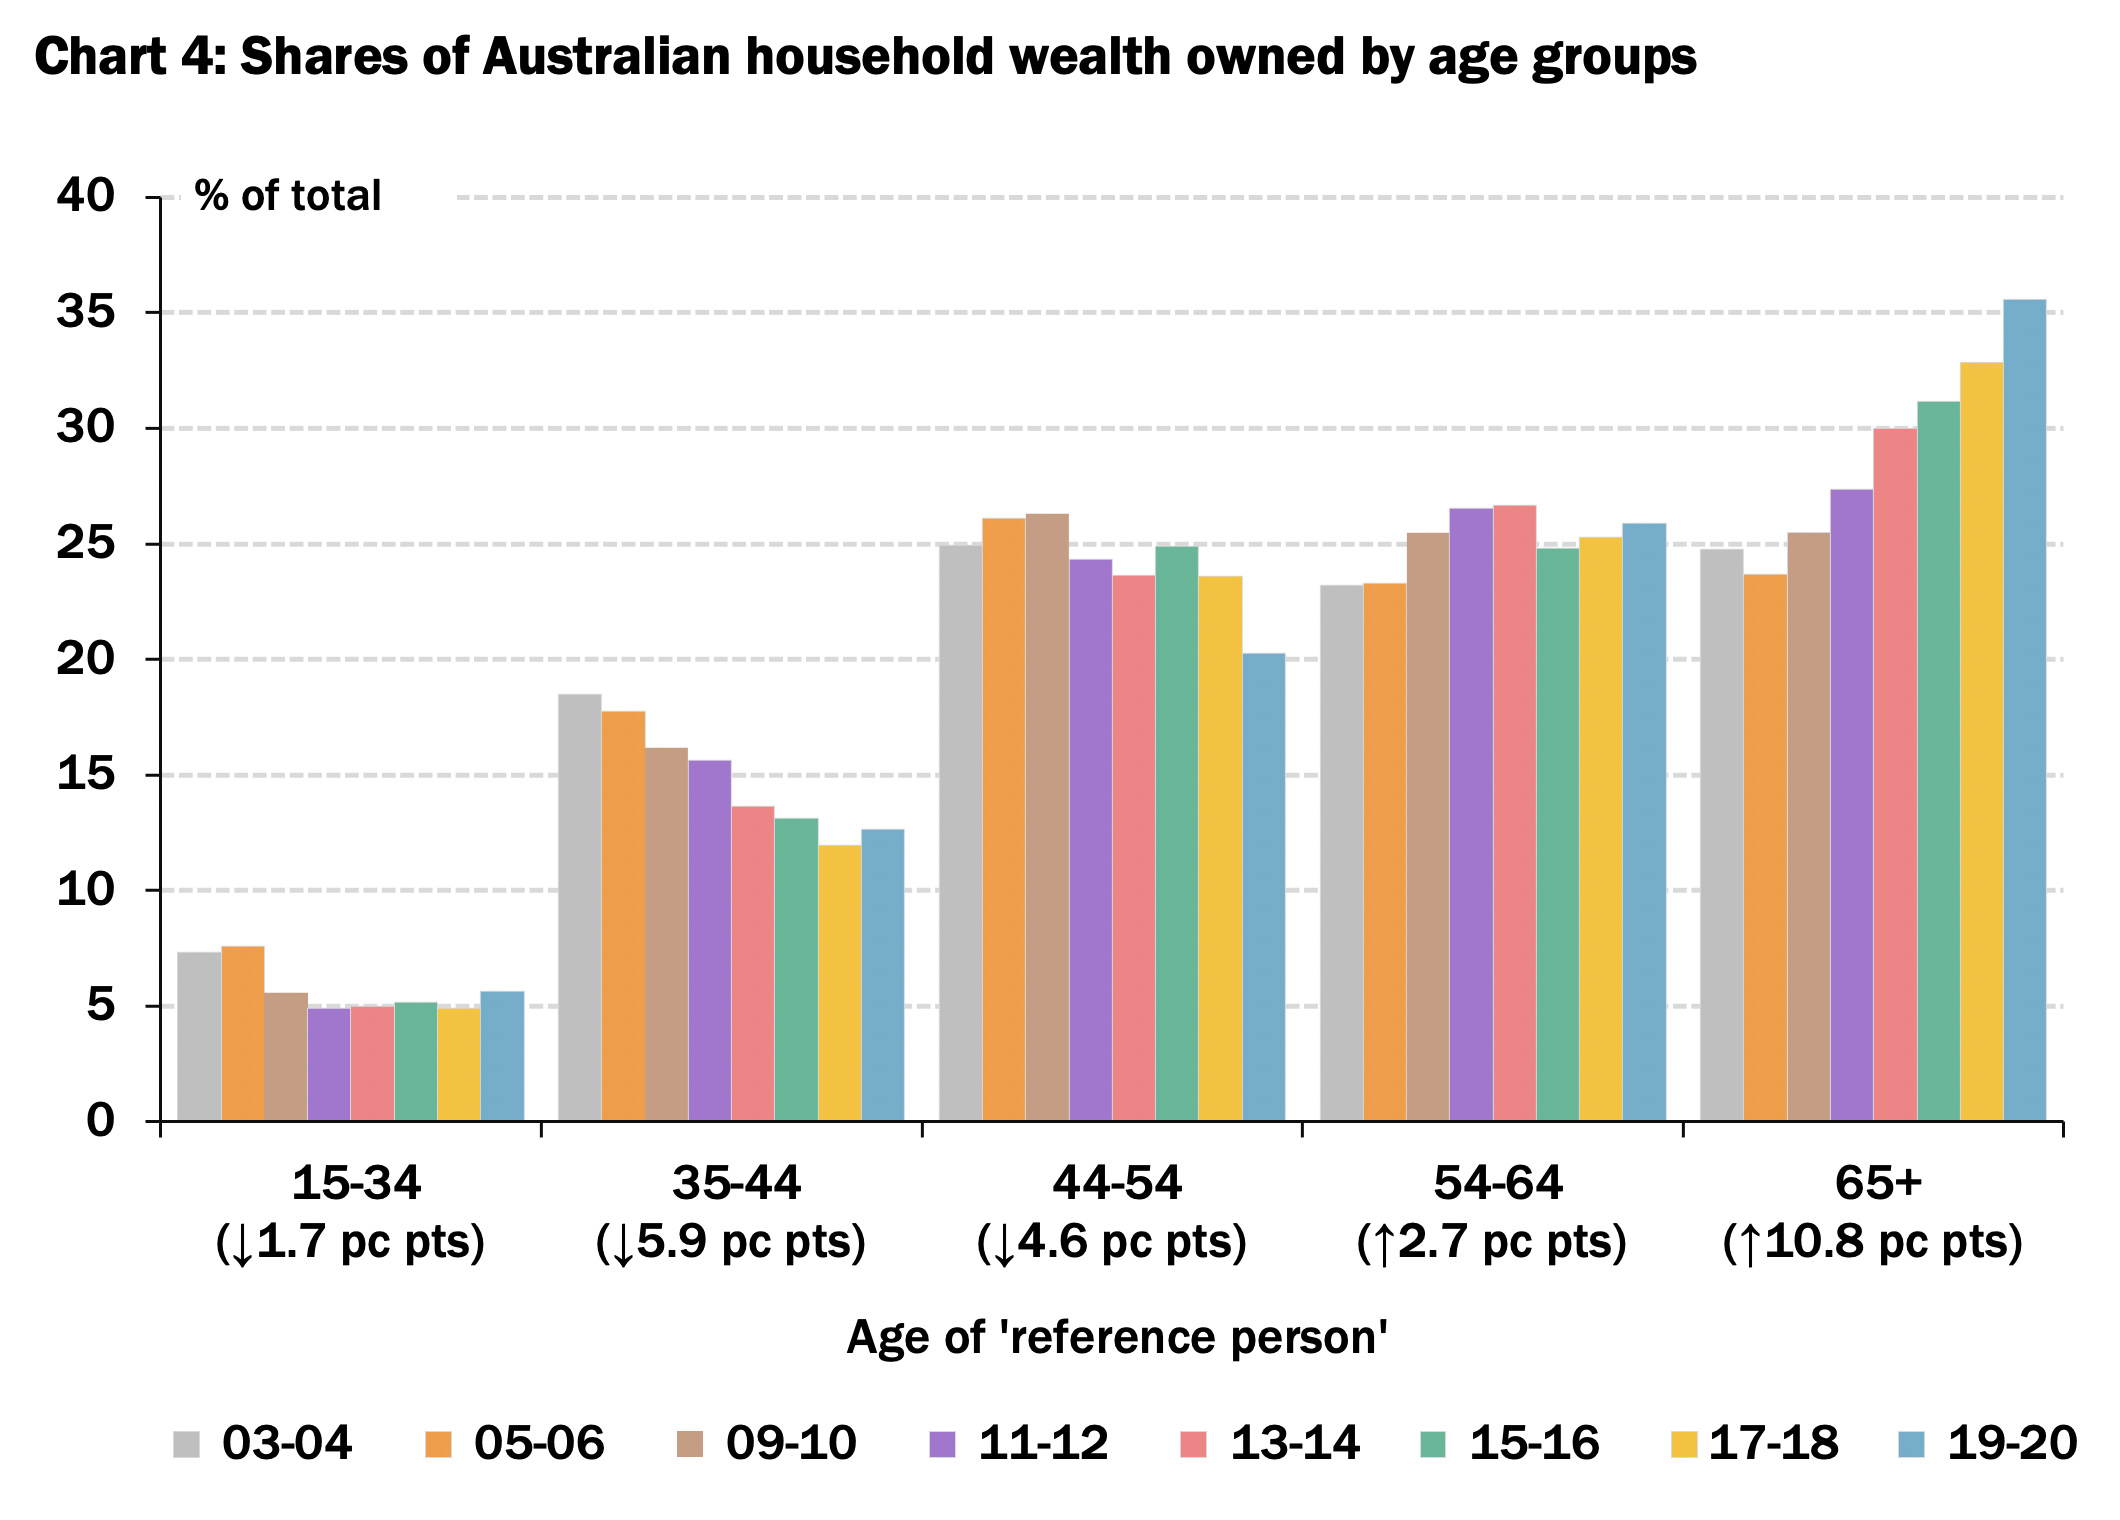
That may seem to be a rather small shift over a period of sixteen years. But it is much more dramatic if viewed through an intergenerational lens — that is, by age group rather than the more traditional net worth quintiles.
As Chart 4 shows, the share of household wealth owned by households where the “reference person” (the ABS’s update of the outmoded “head”) is sixty-five or older rose from 24.8 per cent in 2003–04 to 35.6 per cent in 2019–20 — an increase of 10.8 percentage points — while the share of wealth owned by households aged fifty-five to sixty-four rose by 2.7 percentage points. These gains were at the expense of younger households: the shares of total household wealth owned by households aged fifteen to thirty-four, thirty-five to forty-four and forty-five to fifty-four fell by 1.7, 5.9 and 4.6 percentage points respectively between 2003–04 and 2019–20.
Source: World Inequality Database.
Source: ABS, Household Income and Wealth, Australia, 2019–20 and previous issues.
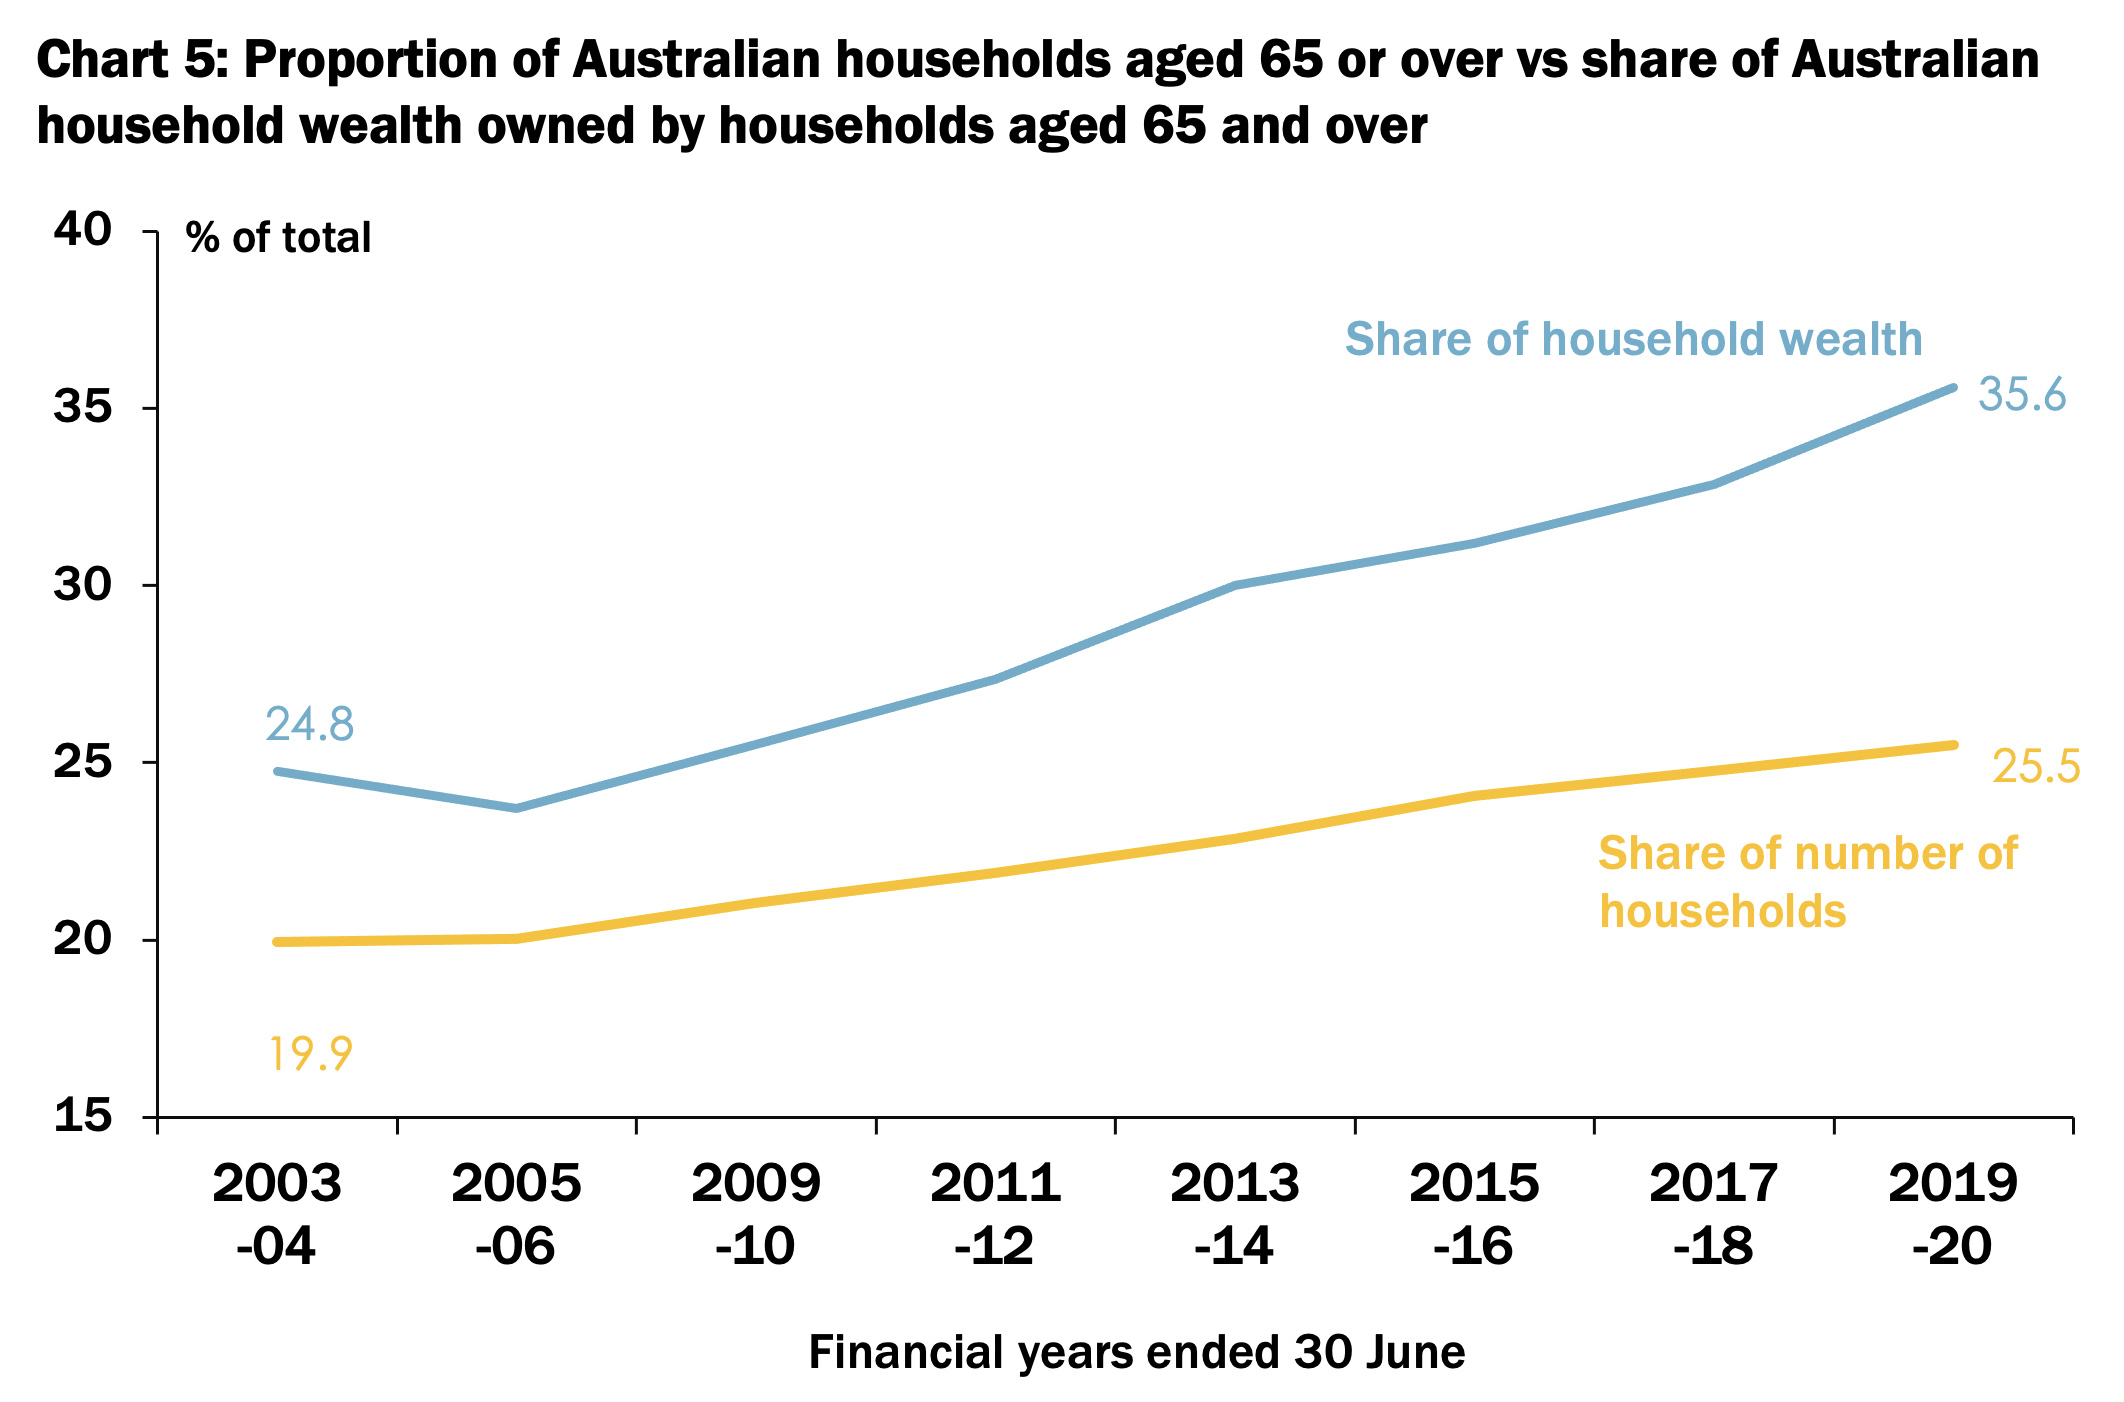
It is to be expected, of course, that older households will be richer than younger ones on average, since they have had longer to accumulate income and generate wealth. And it would be surprising if the share of household wealth owned by older households hadn’t risen to at least some extent over the past two decades, given that older households account for a greater share of the population.
But the ageing of Australia’s population doesn’t go anywhere near fully accounting for the extraordinary increase in the share of household wealth owned by older households over the past two decades. As shown in Chart 5, the proportion of Australian households where the reference person is sixty-five or older rose by 5.6 percentage points between 2003–04 and 2019–20 — barely more than half the increase in the share of household wealth owned by those households.
Source: ABS, Household Income and Wealth, Australia, 2019–20 and previous issues.
Rather, the main reason for the striking increase in the inequality of wealth holdings across age groups has been that older households own a rising share of the two assets that account for most household wealth — property (56 per cent of total household assets) and superannuation (33 per cent) — which have been growing in value. Younger households, meanwhile, owe most of the liabilities that are offsets to wealth — mortgages (90 per cent of total household liabilities) and student debt (3 per cent) — which have grown at a faster rate than assets over the past two decades.
A particularly important contributor to increasing wealth inequality across age groups has been the decline in home ownership rates among younger households. Australia’s home ownership rate declined by 6.6 percentage points from its peak at the census of 1966 to 65.9 per cent at the most recent census, in August 2021.
But that conceals very different trajectories across different age groups. As shown in Chart 6, the home ownership rate among people aged between twenty-five and thirty-four fell from a peak of 61 per cent at the 1981 census to 43 per cent in 2021, only one percentage point above where it had been at the first postwar census in 1947. The home-ownership rate among thirty-five to forty-four year-olds fell from 75 per cent in 1981 to 61 per cent in 2021, eleven percentage points lower than it had been at the census of 1954. Even among forty-five to fifty-four year-olds, the home ownership rate of 70 per cent at the 2021 census was down by eleven percentage points from its peak thirty years earlier, and five percentage points lower than it had been sixty years previously.
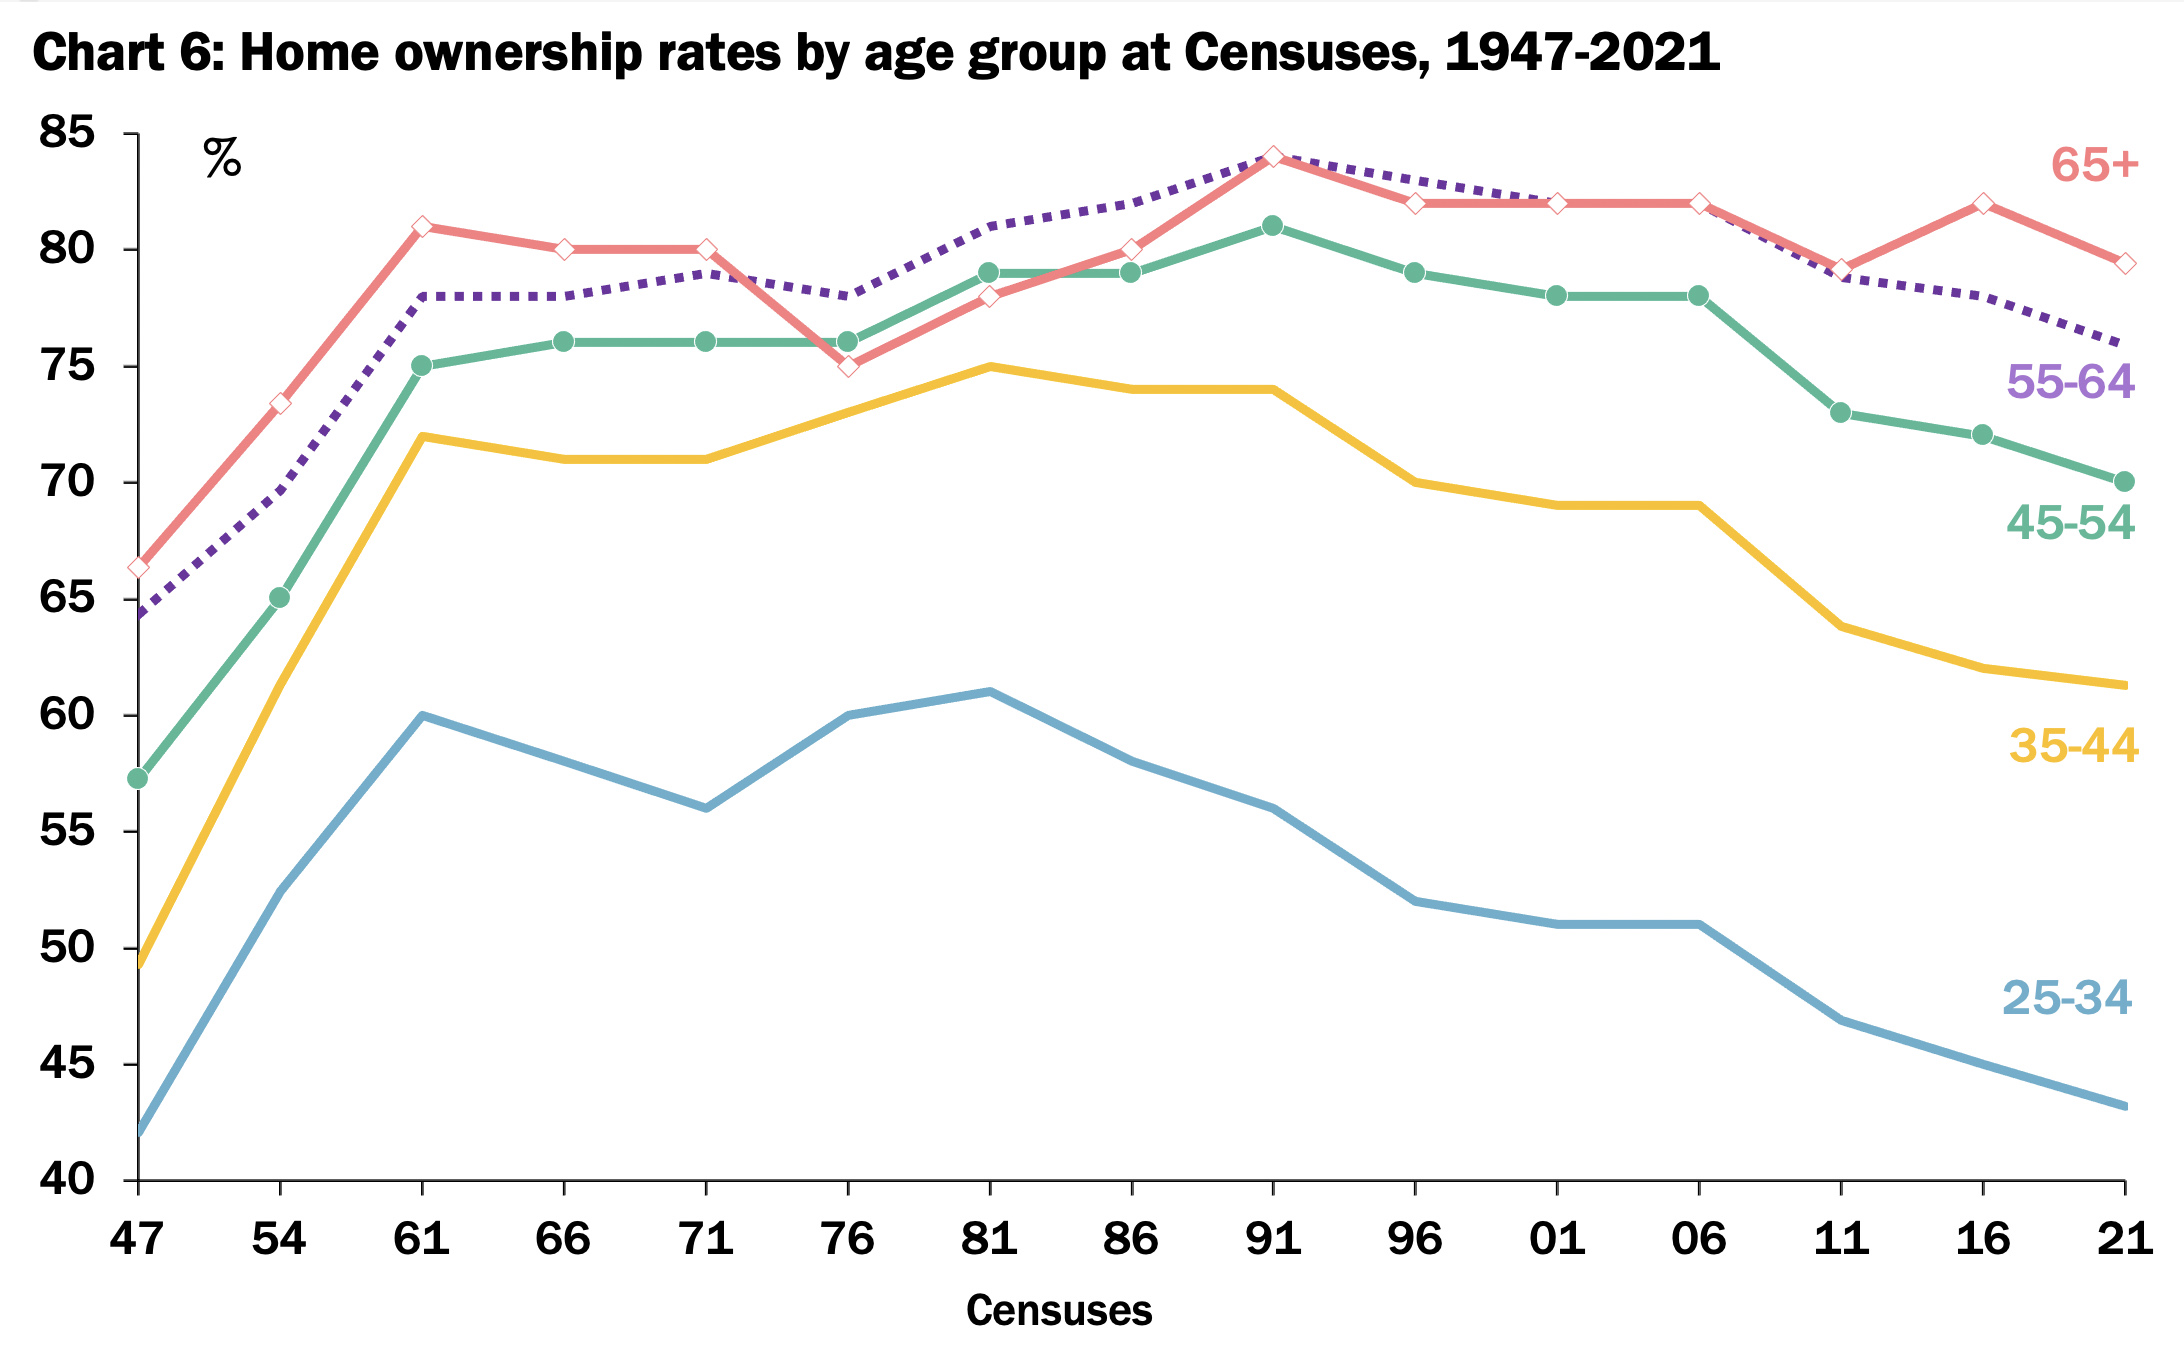
Sources: ABS, Housing: Census, 2021 and previous issues; Judy Yates, Submission to the Senate Economic References Committee on Affordable Housing, 2015; Rachel Clun, “Mortgages in Retirement Triple, Outright Ownership Halves for Most Age Groups,” Age, 17 July 2022.
To some degree, the decline in home-ownership rates among people in their twenties and thirties compared with people at a similar stage of their lives in the immediate postwar decades reflects differences in lifestyle and career choices between Generations Y and Z and their Baby Boomer parents or grandparents. Not too many of the former are getting married and having children, as the overwhelming majority of their parents and grandparents did at similar ages; and most of them have spent longer in the education system and thus started working, earning and saving later in life than their parents and grandparents.
But a far more important factor has been the decline in housing affordability, as encapsulated by the dramatic increase in dwelling prices as a multiple of whatever measure of income you choose to use, or the fact that it now takes someone on the median household income almost eleven years to accumulate a 20 per cent deposit on a median-priced dwelling, almost three times as long as in 1984.
Another important factor has been the series of conscious decisions by successive Australian governments to allow older people to pay less tax than younger people, either explicitly on the basis of age (as with the Senior Australians’ and Mature Age Workers’ Tax Offsets introduced by the Howard government in 2001 and 2005 respectively) or as a result of taxing particular forms of income (such as capital gains and superannuation dividends and payments, which account for a much larger share of older people’s income) at lower rates than equivalent amounts of income from wages and salaries, which make up the bulk of younger people’s incomes.
Thus, in 2019–20, households where the reference person was sixty-five or older made up 25.5 per cent of the number of households, earned 16.7 per cent of total household income and owned 43.4 per cent of total household wealth — but paid just 7.4 per cent of total personal income tax (Chart 7).
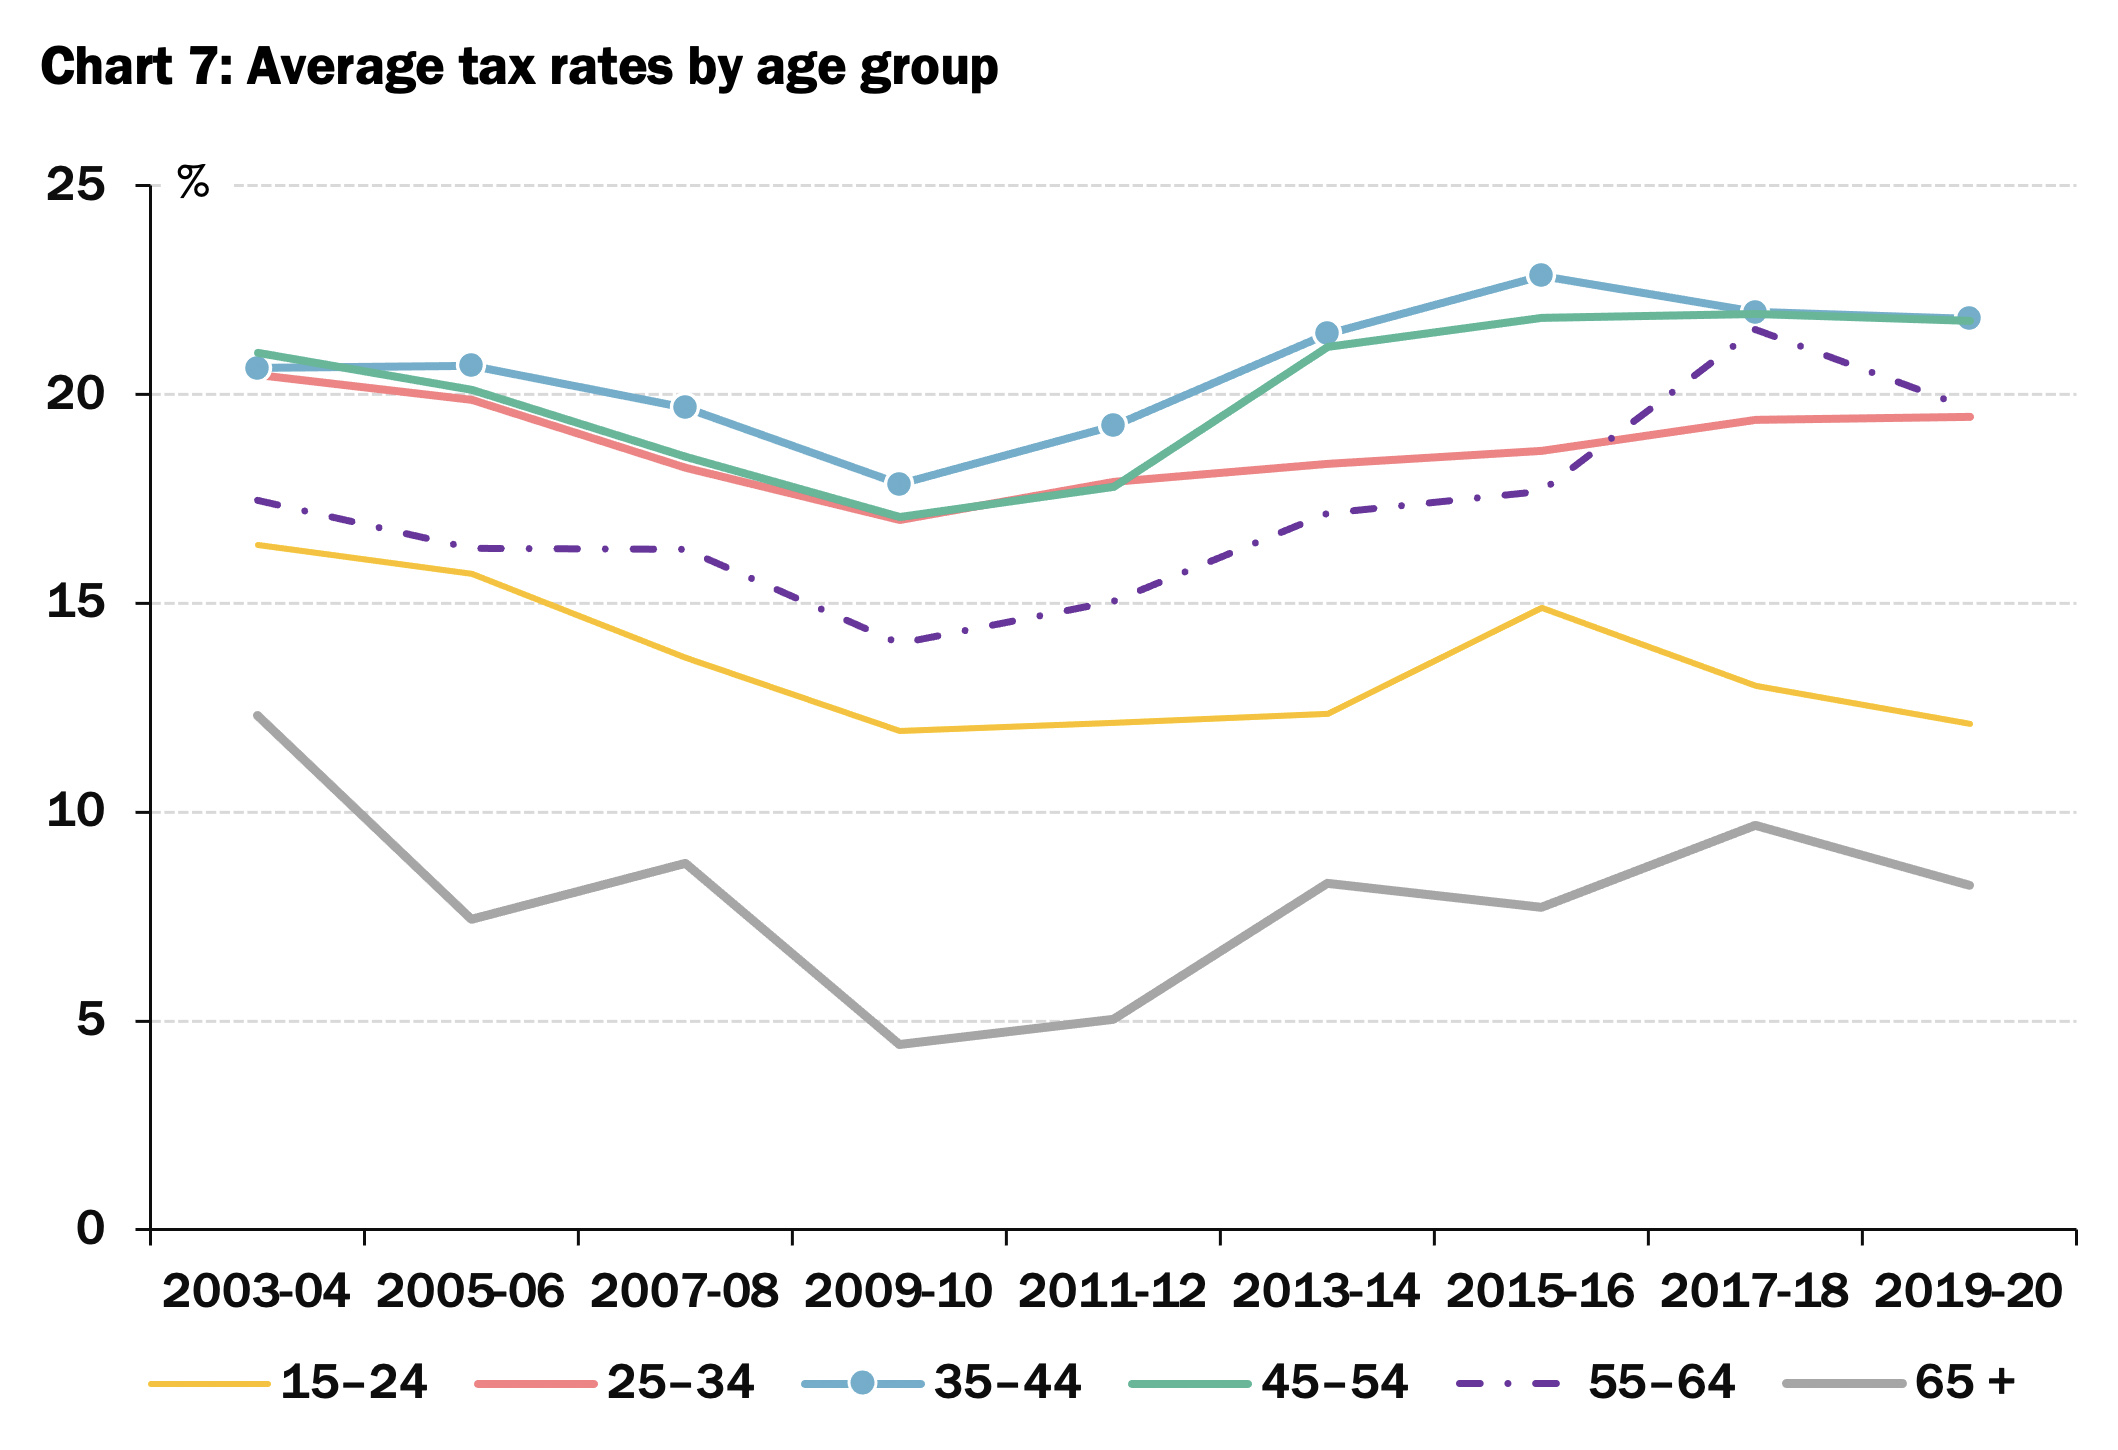
Source: ABS, Household Income and Wealth, Australia, 2019-20 and previous issues.
What could be done to reverse this trend?
Given the role home ownership traditionally played in allowing a broad spectrum of the population to accumulate wealth and, in particular, secure some degree of security in retirement, the most important thing would be to reverse the slide in home ownership among younger age groups.
In recent years governments of both major political persuasions have adopted the view that the best way of reversing the deterioration in housing affordability is by boosting the supply of housing. Yet both major parties have been extraordinarily reluctant to back away from policies that inflate the demand for housing.
Cash grants and stamp duty concessions to first-home buyers, shared equity schemes and deposit guarantee schemes have continued to increase — notwithstanding more than sixty years of evidence that such programs serve only further to inflate house prices. Indeed, the leaders of both major political parties made their attitude clear during the federal election campaign when they proposed policies that would boost housing demand and stated that they wanted housing prices to “keep going up” (at least they were both being honest about that!).
To curb increasing wealth inequality across age groups, governments should also reduce the concessional tax treatment of the types of income that disproportionately accrue to older and wealthier taxpayers — particularly the treatment of capital gains, dividends and superannuation earnings and payments.
Finally, governments could consider reintroducing some form of taxation of inheritances or bequests — especially given the scale of wealth likely to be bequeathed to their children by Baby Boomers, which some estimates put at almost $5.5 trillion.
Although such a tax would inevitably be depicted as “socialism” (or worse) by politicians and commentators across the spectrum, Australia is actually something of an outlier among OECD countries in not having any form of inheritance taxation.
In particular, both the United States and Britain — whose tax systems are commonly used as points of comparison for Australia’s — do both levy taxes on large estates; and neither Ronald Reagan nor Margaret Thatcher, both of whom undertook significant tax reforms, saw fit to abolish them. Nor, for that matter, did Sir Robert Menzies during his nineteen years as prime minister of Australia.
Ironically, the abolition of Australia’s federal death duties was precipitated by Labor icon Gough Whitlam, who promised to do so in his doomed 1975 election campaign (echoing a similar move begun at the state level by Queensland’s Joh Bjelke-Petersen) — prompting Liberal leader Malcolm Fraser to make a similar promise ahead of the 1977 election, which he implemented after winning by a similar landslide to his victory in 1975.
The US federal government collected US$32 billion in revenue in 2023–24 from estate taxes levied on estates valued at more than US$13.6 million (the threshold is indexed annually for inflation), or about 0.2 per cent of all estates; the British government collected £7.5 billion from inheritance taxes levied on estates valued at over £325,000 in 2023–24 (the Office for Budget Responsibility expects this revenue to double by 2029-30).
Given that some 64 per cent of inheritances in Australia go to people aged fifty-five or over, most of whom are already in the upper half of the wealth distribution, a tax on inheritances of more than (say) $3 million — with an exemption for surviving spouses or partners, and perhaps with some incentives for bequests to registered charities — would likely make a useful contribution to curbing the seemingly inexorable upward trend in the concentration of wealth in older and wealthier hands.
Increasing inequality in the distribution of income and wealth has adverse economic and political consequences. Economists should be doing more to bring those to the attention of the Australian public, and to propose politically workable solutions. •
This article is based on a talk given by Saul Eslake to a Business Breakfast in Hobart on 16 May 2025 hosted by the Tasmanian Division of the Salvation Army for the launch of their annual Red Shield Appeal. A podcast of that talk, and a copy of the slides accompanying it, can be viewed here.