As we approach the finish line, talk has turned to preferences, and the methods by which pollsters determine their two-party-preferred figures.
It’s an increasingly important topic because combined the major-party primary vote continue to decline, with most pollsters suggesting it will be even lower this time than 2022’s postwar record of 68.3 per cent. At that election, recall, a better-than-expected flow of preferences by supporters of minor parties to Labor partially rescued those pollsters after they nearly all overstated Labor’s primary support and understated the Coalition’s.
But the longer-term trend also renders national two-party-preferred figures less informative than they were in the old days when the big two could be expected to haul nearly all the electorates. (National primary-vote figures, without reference to preferences, are even more useless when it comes to anticipating total seat numbers — but they can, as today, suggest a strong possibility of many third-party victories.)
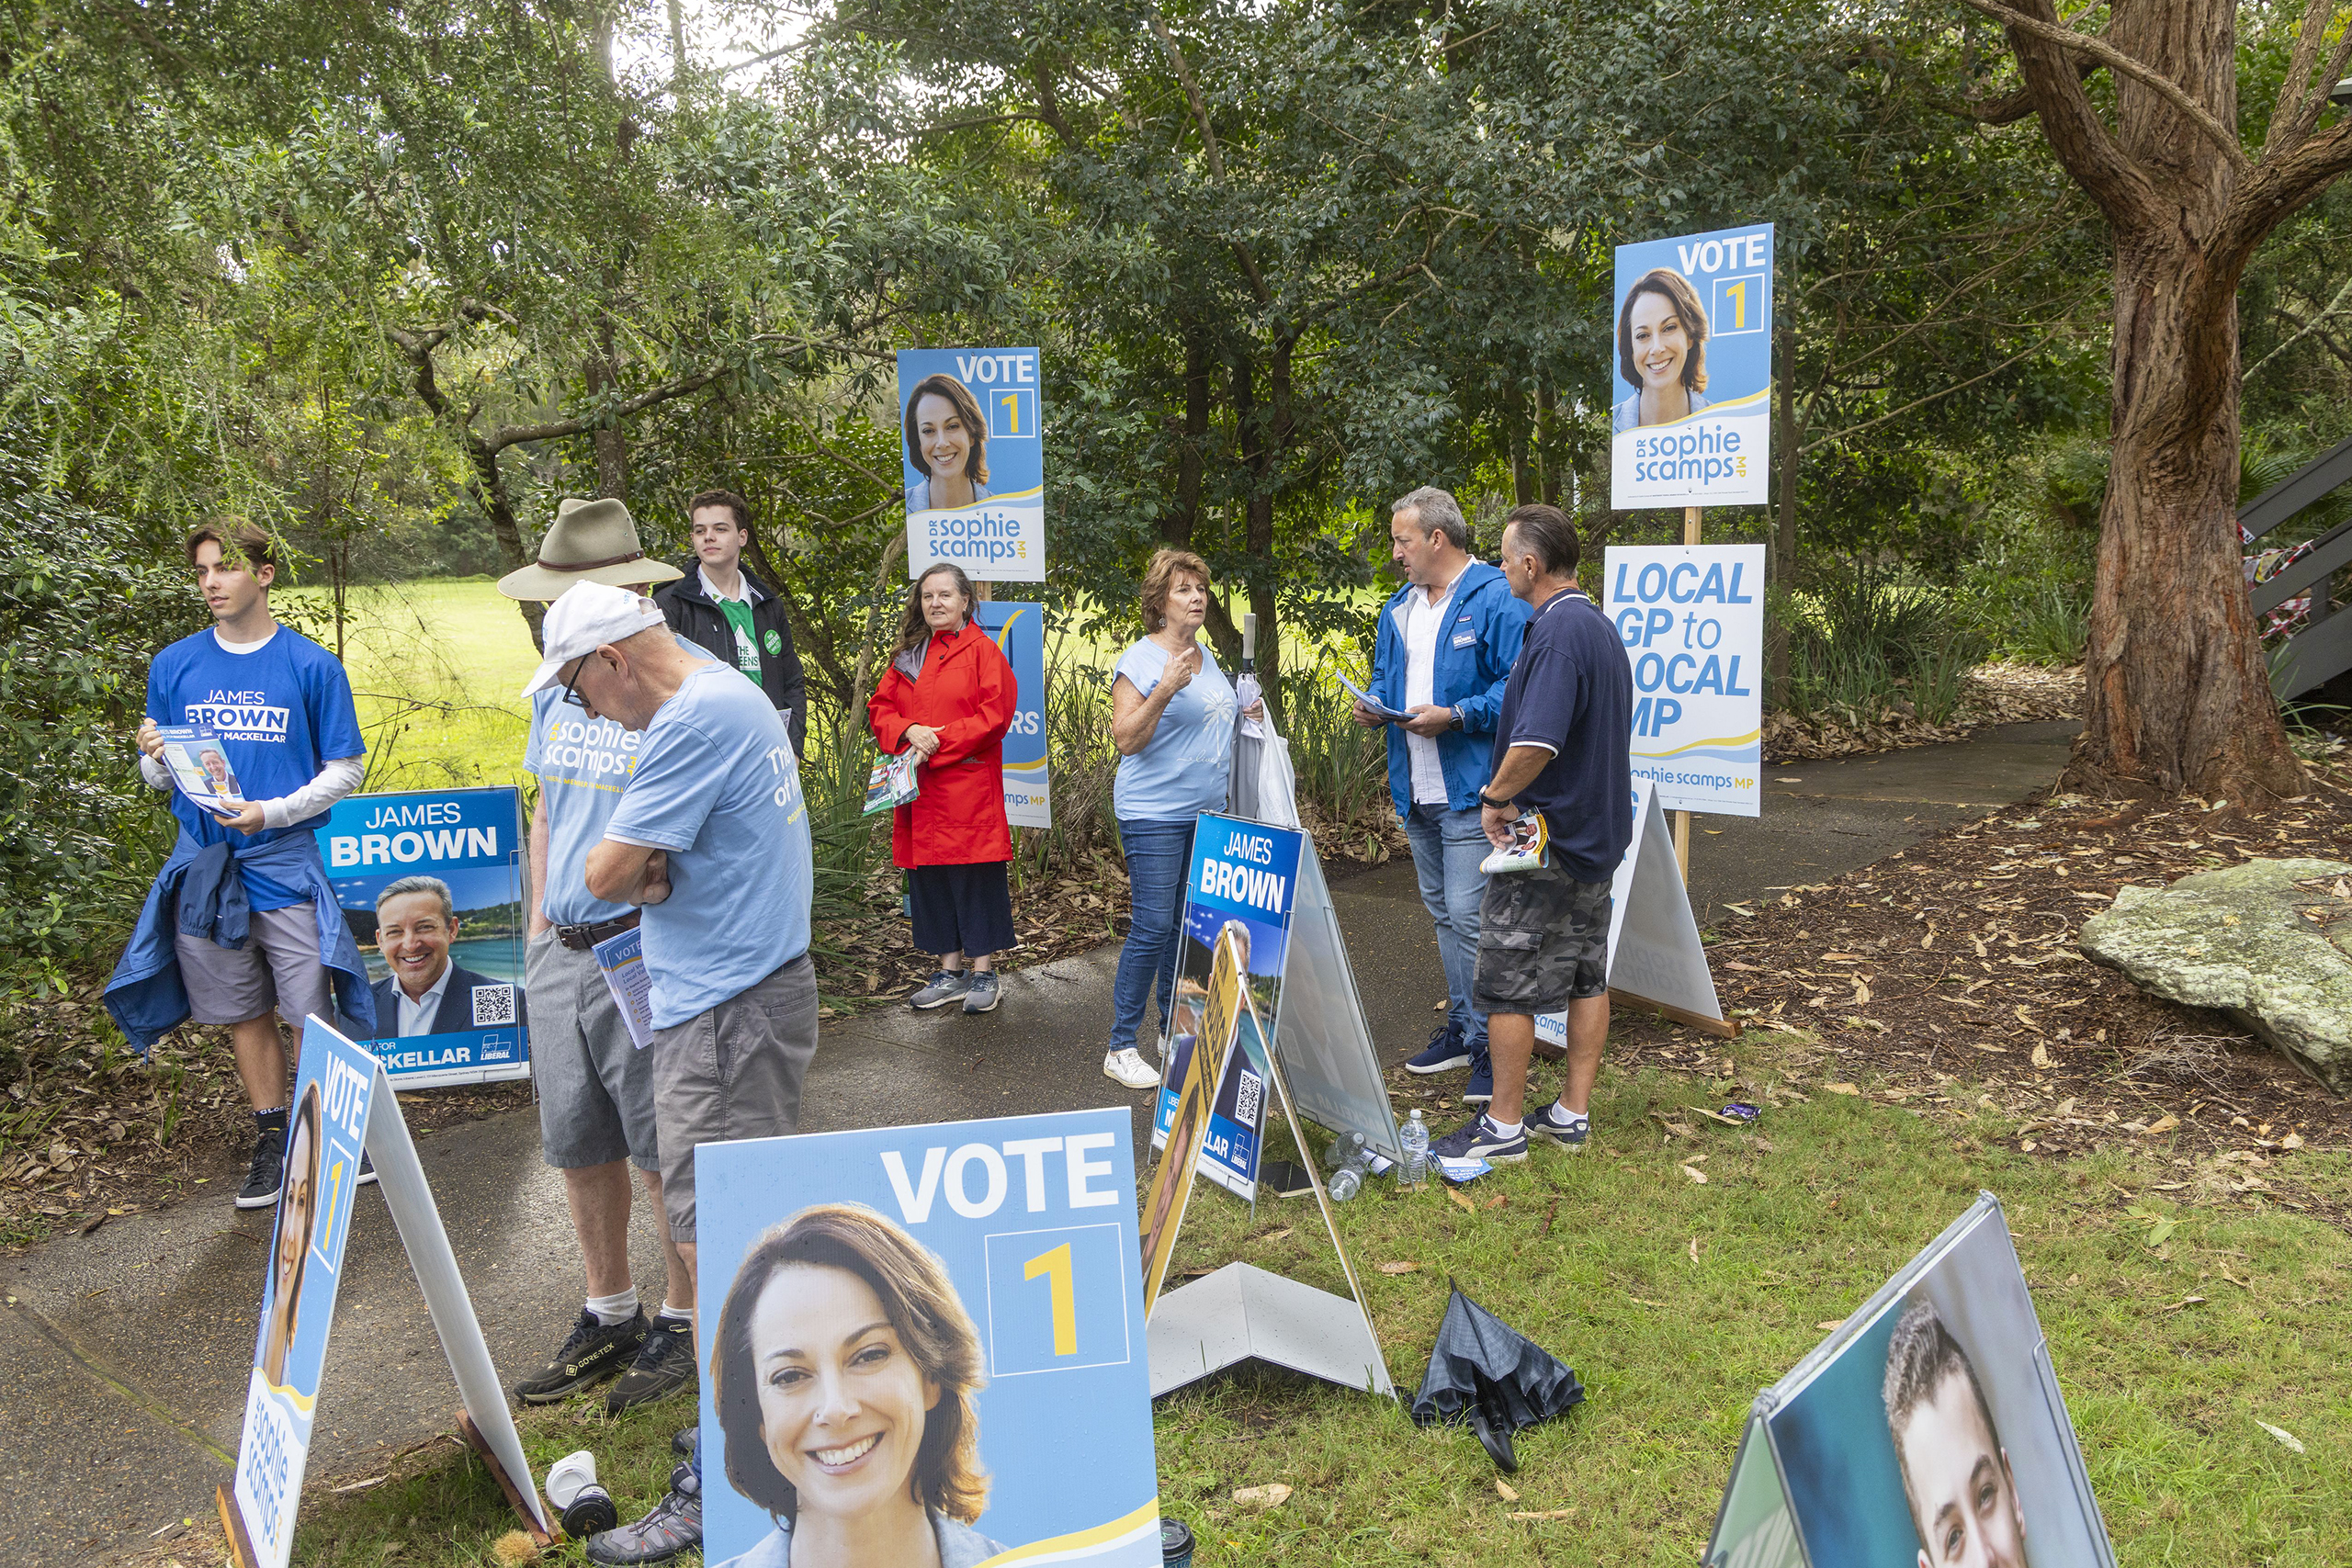
Any discussion of preference flows should also mention how-to-vote cards; they go together like a horse and carriage. How influential are One Nation cards, for example, which in 2025 and 2022 recommend the Coalition ahead of Labor? That’s hard to answer. To begin with, voters have to actually see them, which means you need lots of volunteers (or, as in the case of Clive Palmer’s Palmer United Party in 2013, paid backpackers, preferably female and Swedish) to get them into voters’ hands.
In this final week there’s chatter from Coalition insiders to the effect that the polls showing them headed for a flogging are wrong; their own polling shows they’re competitive, and one reason is that preferences from minor-party voters will flow to them much more than pollsters assume.
How much more? In this Financial Review piece one of them predicts the Coalition will receive “between 80 per cent and 90 per cent of right-of-centre preferences.” (In 2022 the overall figure — One Nation, Palmer etc — was 65 per cent.) By this the party insiders mostly mean One Nation, which is running in 147 out of 150 electorates and polling a few points higher than its 5 per cent result three years ago. But they’re also including the much lower-rating Trumpet of Patriots (Palmer’s current iteration, contesting one hundred) and Libertarians (formerly Liberal Democrats, forty seven candidates).
The Financial Review piece features some supporting evidence from JWS Research, whose boss John Scales also features in a Nightly article that sets out largely to demolish a straw man: the claim that the “vast majority of current polls… determine preference flows based on 2022.” This was might have been roughly true a couple of years ago, but as Kevin Bonham points out it certainly isn’t anymore.
The Nightly piece does, however, posit a much more realistic 75 per cent flow from far-right parties. But while it rightly points out that One Nation’s polling numbers have greatly improved, it neglects to note that the opposite is the case with Palmer’s new, clumsily named acquisition, which is barely registering.
In 2022 One Nation received 5.0 per cent, United Australia 4.1 and LDP 1.7, with preference flows to the Coalition over Labor of 64.3, 61.9 and 71.8 respectively: 65 overall. (Why was LDP/Libertarian’s figure noticeably higher? The most likely answer is that their voters were simply more pro-Coalition on average.)
The Nightly article quotes Scales declaring there are “three golden rules in polling: you must have a robust sample north of 800 voters, you have to name the exact candidates on the ballot, not just the parties [only doable, of course, after nominations are published], and you have to ask who they’ll preference this time”.
Most pollsters do try to extract two-party-preferred numbers from respondents, and have done for decades. Sometimes they keep it to themselves, or mix it along with historical flows in their special sauce, or simply publish two sets of numbers.
But getting reliable figures isn’t easy. You can remind third-party or independent respondents that they’ll need to rank one major party above the other on the ballot paper, so which will it be? The big problem is that that nowhere in the actual voting process is this information related. Many or even most voters don’t really understand preferential voting; in particular, once they’ve put a “1” next to their chosen candidate, a lot of them don’t place much importance on who else they number, as long as all boxes are filled (consecutively!) so their vote counts.
How else could pollsters collect this information? In the olden days of door-to-door surveys (Roy Morgan Research in particular continued this well into the current century) a dummy ballot paper with pencil was given to respondents. That, intuitively, is much better. In these days of online polling the ballot paper can roughly be replicated on a web page form.
Nine’s Resolve does this, and while its final primary-vote figures for the major parties were pretty awesome in 2022 (just a point low for each, so pretty much nailing the Coalition’s 3.1 percent lead) it understated preference flows to Labor so much that its published headline two-party-preferred figure had the gap narrowing by a point (51 to 49) when it actuality it increased by around one (52.1 to 47.9).
The replicated ballot paper approach has its problems too. An obvious one is that survey respondents don’t have how-to-vote cards, so any influence the cards do have is missing. I have a theory, untestable until the day pollsters publish their party-by-party flows, that Greens cards, which preference Labor everywhere, have a meaningful impact on preferences for two reasons: because of the party’s plentiful supply of volunteers at polling places and because it gets easily the largest vote of any minor party (12.2 per cent in 2022), which can lead to underestimation of Labor’s two-party support.
One Nation and the smaller right-wing parties generally don’t have the same-sized army of volunteers, especially if they contest many seats, and the aforementioned lackadaisical approach among some of their supporters to numbering every square pulls the overall flow down to a bit closer to 50–50.
Both of these factors would help Labor do better, and the Coalition worse, than pollsters’ flows suggest they would. But it’s possible One Nation has more volunteers this time. There’s been a report of Liberal supporters helping independent MP Dai Le in Fowler; might they be doing the same for One Nation?
The preference flow from far-right voters to the Coalition will probably increase on Saturday, if for no other reason than it hit a low point last time; and Peter Dutton, in his political rhetoric, has always been more their kind of guy than Scott Morrison was. We know the Coalition is paying close attention to them, and has been rather cosy with the largest. Substantial shifts from 2022 will be evident on election night, but the actual numbers won’t be published for more than a month. It will be very surprising if One Nation’s flow to the Coalition exceeds 80 per cent. Ninety per cent? Forget it.
And if the election is much closer than current polls say it will be, the chief culprit will be the usual one: pollsters overstating Labor primary support.
See you on Saturday morning for the final round-up. •
