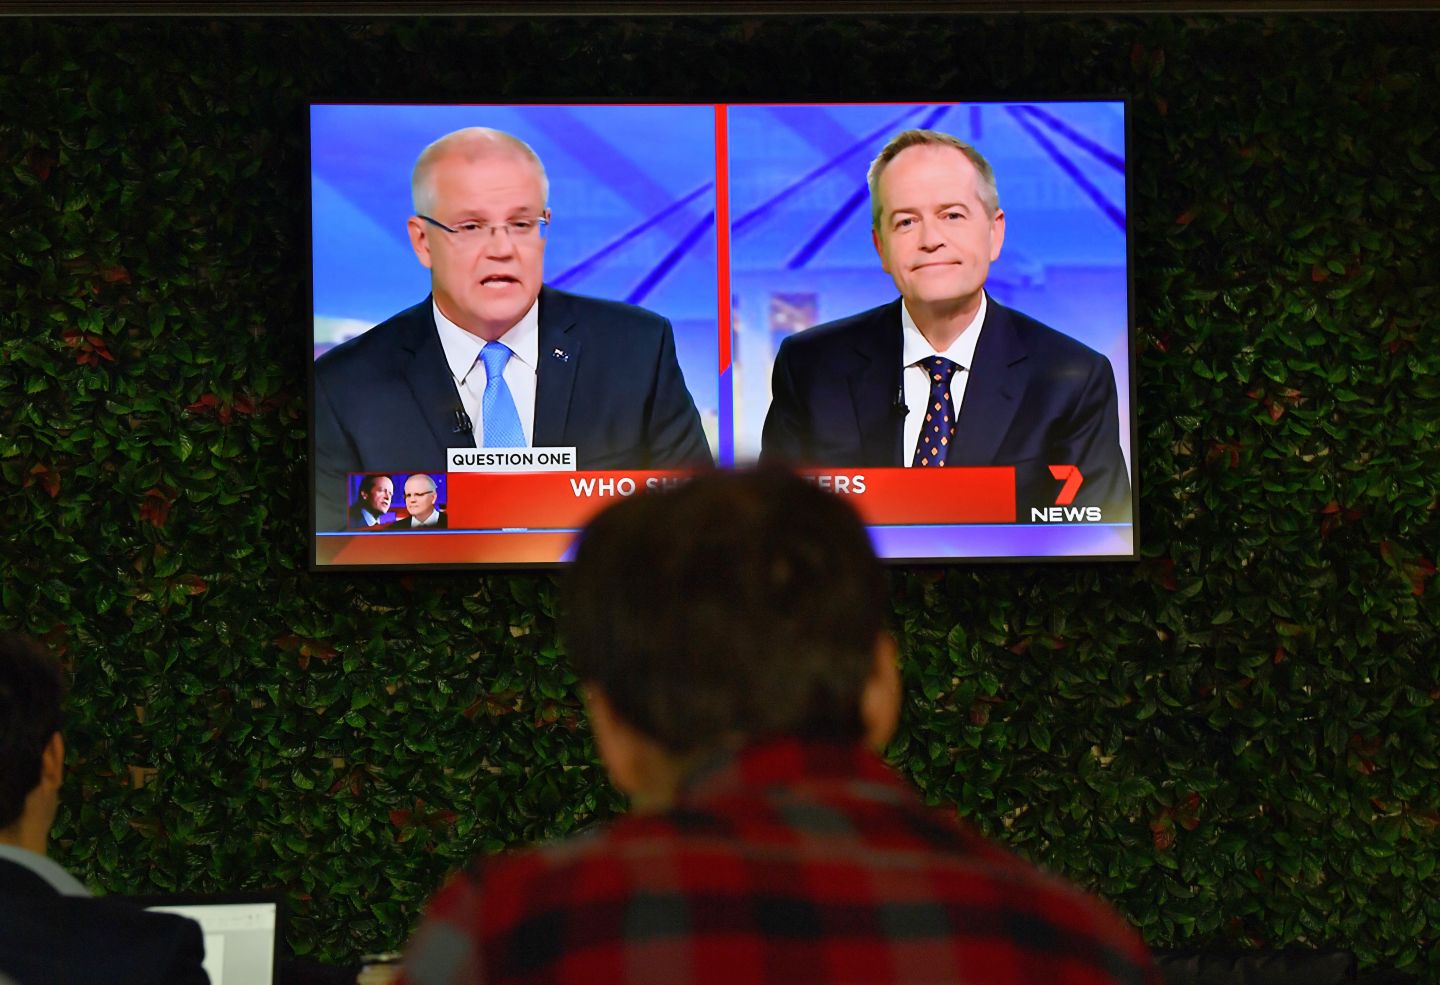
As the last week of the 2019 election campaign got under way, the major polls were showing essentially the same picture. Each of them had Labor slightly ahead (either 51–49 or 52–48) on a two-party-preferred basis, and each had both the major parties polling less than 40 per cent of the primary vote. As always, how these figures translate into parliamentary seats, and how much they will change between now and election day, is being hotly debated.
Every election is unique, of course. But when we are trying to guess what might happen in the near future, looking at past patterns can help us see where the current campaign fits, and guide our weighting of likelihoods and probabilities. It also helps us see what has changed and what hasn’t.
As Table 1 shows very vividly, Australia goes to the polls relatively often: twenty-eight times in seventy years, during a period in which Britons voted in nineteen parliamentary elections and Americans in eighteen presidential elections. This is no surprise, given that the constitutionally determined maximum interval between federal elections is just three years from the date the House first sits after an election. Sometimes it is a little shorter (as this year) to accommodate the different rules governing Senate elections. Sometimes prime ministers see an opportunity and call an election earlier than they need to.
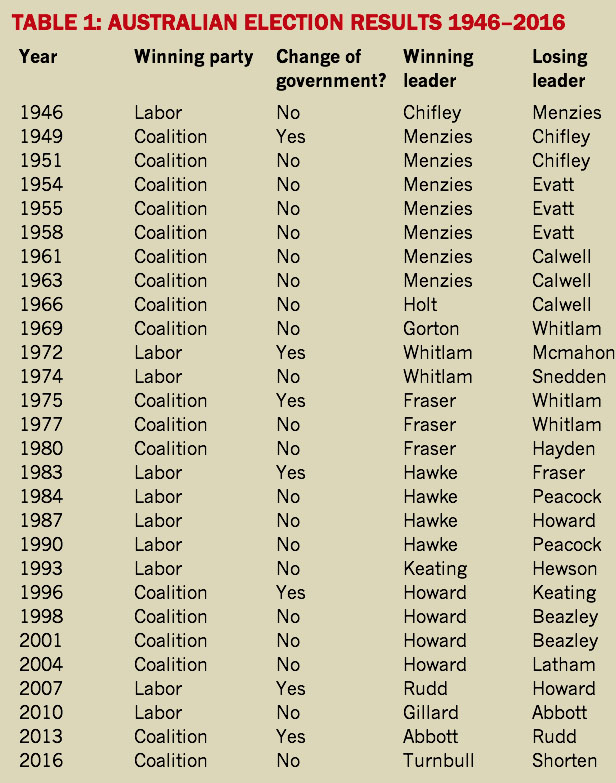
A quarter of those elections have seen a change of government. The only pattern is that no government has been thrown out of office at its first attempt at re-election, although Julia Gillard did lose Labor’s majority in 2010. Some governments have been very long-running — Robert Menzies and his Liberal successors won nine elections; Labor’s Bob Hawke and Paul Keating won five; John Howard won four; and Malcolm Fraser three. But each of these governments had at least one brush with near defeat.
Of those twenty-eight elections since 1946, the Coalition won eighteen and Labor ten, the discrepancy largely reflecting the Liberals’ nine successive victories during the twenty-three years from 1949 to 1972. Since 1972, Labor and the Coalition have won nine elections each.
Minor parties and independents are treated more kindly by Australia’s system of preferential voting than by the first-past-the-post systems in Britain and the United States. Voters can express both a preference for a minor party with their first vote and a second preference for a major party, which allows them to affect the result if their preferred candidate is eliminated.
The outstanding feature of Table 2 is the recent increase in the vote for “others,” and the corresponding fall in the combined vote for the Coalition and Labor. Until 1987, the highest percentage of “other” votes, at 12.3 per cent, came in 1977. Nine of the ten elections since 1990 have recorded a higher figure than that.
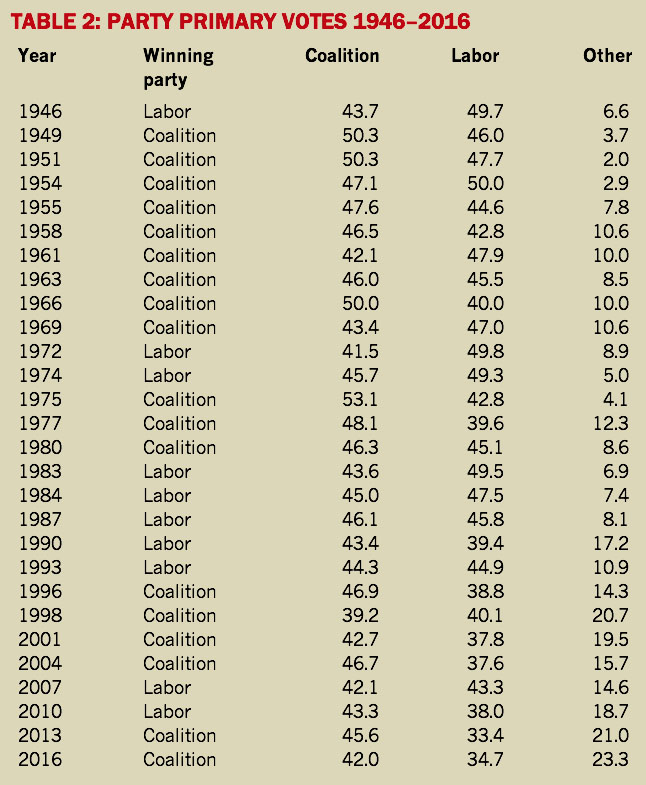
Twice in earlier times, the vote for minor parties had surged when a new party emerged. The first followed the Labor split of 1955, and the rise of the breakaway Democratic Labor Party, or DLP. The second followed the formation of the Australian Democrats by a former Liberal minister, Don Chipp, in 1977. In both cases the major parties recovered much of the lost vote over time.
But the current situation, with “others” topping 20 per cent in the last two elections, looks likely to be a continuing feature of the Australian political landscape. The most important of the other parties is the Greens, but Pauline Hanson’s One Nation and Clive Palmer’s United Australia Party are also a substantial presence in 2019, and a large range of independents have enormously varying prospects in their own seats.
Table 3 shows the election results according to the winning two-party-preferred margin. This measure, popularised by the political scientist Malcolm Mackerras, is designed to take account of the two key facts about Australian elections: it is a preferential voting system in which the distribution of second preferences from minor parties may be crucial; but the key contest is between the two major parties — Labor and the Liberal–National Party Coalition.
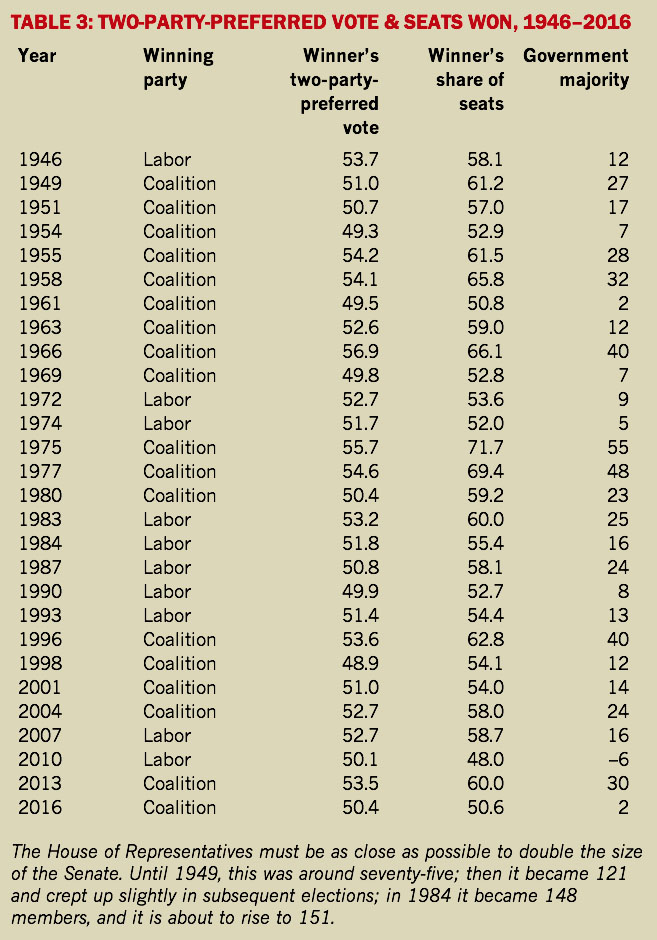
This table also highlights another feature of Australia’s single-member system in the House of Representatives: the number of seats won is not necessarily proportional to the total vote obtained. (They can even go in opposite directions: in 1987 Labor’s two-party-preferred vote dropped 1 per cent but it increased its majority.) In almost every election, the winning side won a greater proportion of seats than of votes, and the disproportionality has sometimes been quite marked.
Two patterns are apparent. The first is that the greater the winning margin, the more marked becomes the disproportion. In other words, the electoral system tends to magnify landslides. The second is that the system has, over all, been kinder to the Coalition than to Labor. Only on two of the twelve occasions when the difference between votes won and seats won has been more than 6 per cent has Labor been the beneficiary.
The conventional explanations for the difference between parties are that for many years the distribution of seats was weighted towards more conservative rural electorates, and that too much of Labor’s vote was locked up in the working-class electorates it tended to win by large margins. Both these explanations have become weaker with time. The disproportion has been smaller recently, perhaps reduced partly by the success of independents and minor parties in winning seats.
In this single-member, preferential voting system, the flow of preferences is crucial to who forms government. Occasionally there is careless commentary that a party needs at least 40 per cent of the primary votes to form government, but twice already — Labor in 2010 and the Coalition in 1998 — government has been won with less than that percentage. In all seats where the candidate does not obtain 50 per cent of the vote in the first round, what matters is the post-preference count.
The DLP’s preferences went overwhelmingly to the Coalition; the Democrats’ tended to go more to Labor, but by a much smaller amount. Among current groups, the Greens’ second preferences flow more than 80 per cent to Labor. The likely preference flows for Pauline Hanson’s One Nation and Clive Palmer’s United Australia Party are less clear, but 60–40 to the Coalition is a commonly cited figure.
Because the distribution of seats doesn’t necessarily match the distribution of votes, winning sides have prevailed on five occasions despite receiving less than 50 per cent of the two-party-preferred vote. If the distribution of votes between seats had been different, they could easily have lost. Each of these elections (1954, 1961, 1969, 1990 and 1998) was a case of an incumbent government performing less well than its opponent but managing to win because it retained its most vulnerable seats. Interestingly, the government with the smallest-ever winning share of the two-party-preferred vote was John Howard’s in 1998.
Table 3 also shows that Australian elections tend to be close, and have become even closer. Over the twenty-eight elections, the winner’s two-party-preferred percentage has been between 48.9 and 51.0 on thirteen occasions, or just under half. In only nine has the winning side won 53 per cent or more. The largest victory was in 1966, the so-called Vietnam election, in which a relatively new prime minister, Harold Holt, faced a much older Arthur Calwell. The second- and third-largest victories were by Malcolm Fraser in 1975 and 1977. But in the twelve elections since 1984, the winning side has topped 53 per cent just twice, on both the occasions when the Coalition drove Labor from office.
On the three most recent occasions that Labor won government from opposition, its two-party share was 53.2 per cent (under Bob Hawke in 1983) and 52.7 per cent (under both Gough Whitlam in 1972 and Rudd in 2007). A Shorten victory this year looks unlikely to exceed these figures.
Table 4 describes the net swing measured in two-party-preferred terms at each election. On only seven occasions did the government improve its position in an election — when the Menzies government won in 1955 and 1958 following the Labor split (its share of the vote fell very slightly in 1958, but it gained seats); in 1963 and 1966, when Labor under Arthur Calwell fell further behind after almost winning the 1961 “credit squeeze” election; when Paul Keating’s Labor won the 1993 “Fightback!” election; and when the Coalition won the 2001 and 2004 elections under John Howard.
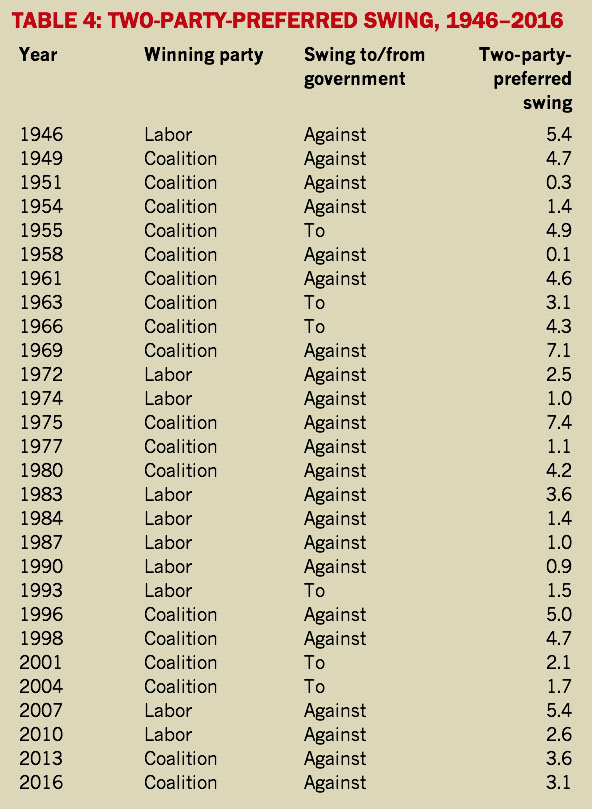
Interestingly, each of these government successes was followed by a large swing back to the opposition. Menzies almost lost the credit squeeze election in 1961; Whitlam made huge strides in 1969; and both Keating (1996) and Howard (2007) ignominiously lost the next election after their 1993 and 2004 triumphs.
The other five changes of government were two-step processes. In the first election the opposition almost draws equal, and then gets a further swing and victory at the next election. This happened in 1946 and 1949 for Menzies; 1969 and 1972 for Whitlam; 1974 and 1975 for Billy Snedden and Fraser; 1980 and 1983 for Bill Hayden and Hawke; 2010 and 2013 for Abbott.
There is great variation in the size of the swings at elections, although in only three of twenty-eight was the swing less than 1.0 per cent. In twelve, the swing was 4.0 per cent or more, with the two biggest, at more than 7.0 per cent, in 1969 and 1975.
Polling and pendulums
The lead-up to an election is always accompanied by the breathless reporting of opinion polls. The news organisations that commission polls have an interest in maximising the news value of the product they have paid for, as well as in increasing the newsworthiness of the election. So the reports of polls tend to highlight change and drama. The following should be borne in mind.
Margin of error. If a poll sample is genuinely random — if every member of the relevant population has an equal chance of being selected — then the results from a sample of 1000 people can be extrapolated to the wider population with 95 per cent confidence to plus or minus three percentage points. In other words, if such a survey showed a result of 50 per cent then the true figure, nineteen times out of twenty, would lie between 47 and 53 per cent. If the random sample is 2000 people then it is accurate to plus or minus two percentage points. If the sample is 10,000, it is accurate to plus or minus one percentage point. It’s important to note that the margin of error follows a normal distribution (or bell curve). If a sample survey of 1000 finds 50 per cent support for Labor, for instance, that is much more likely the true level of support than 47 or 53 per cent.
It is the size of the sample that matters, not the size of the population. As long as the sample is random, then a sample of 2000 can be extrapolated to the Australian population, the state, or an individual electorate with the same confidence level of plus or minus two percentage points. Surveys of individual electorates are often and rightly seen as less reliable, but this is principally because they tend to be based on much smaller samples, and so have a much larger margin of error.
Pollsters sometimes combine several recent polls to explore regional variations. But they also extract state-level figures from national polls, and the size of these subsamples means that they have a much larger sampling error than the survey as a whole.
The value of surveys rests on random selection and probability theory. Polls based on self-selection — when readers record their views on a website, for example — have no scientific validity.
In practice, pollsters can have more confidence than the level suggested by probability theory alone. They know the demographic parameters of the Australian population (gender, age, occupation, location, place of birth, and so on) and can see how well their sample matches them. If instead of the stringent scientific criterion of the result having a less than one in twenty probability of occurring by chance, we adopt a probability of 90 per cent, then a sample of 1000 gives roughly a plus or minus of two rather than three percentage points. If a whole series of polls give a similar result, the pollsters can be more confident.
Sampling distortions. In practice, few surveys achieve pure randomness. Access problems and the need to limit expense produce distortions. In the old days, when most surveys were done face to face, it used to be joked that owners of German shepherd dogs were under-represented. Equally, remote rural dwellers were often under-represented. Landline telephone polls tended to miss younger people who were less often at home, and even now, when the great bulk of the public own telephones (mobiles or landlines), the sampling frame of telephone ownership does not exactly match that of the electorate.
Apart from the shortcuts that cost-conscious marketing organisations may take in obtaining their sample, the other major distortion is that pollsters can’t compel people to respond to questions, and the pattern of refusals — seemingly becoming more common as the years pass — introduces another element of non-randomness.
Probably the most important potential distortion in samples before contemporary Australian elections involves people whose first language is not English. The 2016 census found that 21 per cent of Australians spoke a language other than English at home, with the largest groups being Mandarin, Arabic, Cantonese and Vietnamese. Many of these people are also fluent in English, of course, but it seems likely they are under-represented in a lot of surveys.
Conversion of votes into seats. The election result is determined by the number of seats a party wins, not the total votes it acquires. No single-member system can be guaranteed to give proportional outcomes. If the distribution of the vote is lopsided then this can affect the number of seats won. If the two-party-preferred vote shows a clear margin, the seats are likely to follow, but if the election is close, distribution — and the pattern in the most marginal seats — can become all-important.
One of the icons of Australian elections, the pendulum, shows which seats will change hands with what degree of uniform swing. Swings are never uniform, though; they tend to be very different in different parts of the country. The size of the national swing is often a good guide to the total number of seats that one side will gain (rather than the identity of which seats will change) as different trends cancel each other out.
It’s also important to remember that national polls can never predict whether independents or minor parties are likely to win seats. The pendulum works well for Labor versus the Coalition but not so well when a major contender is a minor party or independent.
Don’t knows and mind-changers. News organisations are interested in a simple, dramatic poll headline. They are interested in opinions rather than lacks of opinion. But along with those who refuse to participate, the “don’t knows” typically form a sizeable proportion. Pollsters try to minimise this by asking which way they are leaning, but for many purposes ascertaining the lack of a settled opinion or the softness of opinion may be as important as the headline result.
The Australian Election Study, which has taken surveys after each election since 1987, finds very sizeable proportions of people saying they decided how to vote during the campaign itself, and quite a few in the final days — enough, by far, to deliver a landslide to one party or the other if all decided in the same direction. But these surveys almost certainly exaggerate the actual degree of indecision. The polls published contemporaneously have never found the size of movement that those surveys suggest is possible. There does seem, though, to have been an increase in the number of softly committed voters who are prone to late decisions.
The potential for people to change their mind or to make their final decision very close to the election is the basis of the explanation pollsters often use when their results don’t match the election results. Rather than present a misleading certainty about what the polls portend, though, they could give more priority to probing degrees of ambivalence and indecision among their respondents.
Distributing minor-party preferences. Australian pollsters have one advantage over those in other democracies. With voting compulsory, they don’t have to estimate which respondents will vote, and which won’t. On the other hand, they have their own special problem, thanks to preferential voting. With the likelihood that the vote for “others” will exceed 20 per cent, the distribution of preferences will be crucial. Although the pollsters’ current protocols are about as good as we are likely to get, this factor could make it harder to predict the result in closely contested seats.
Table 5 shows the current state of the parliament, which saw the Coalition going into the campaign as a minority government. The only other time this has happened since the second world war was in 2013, when the Labor government went on to lose easily to Tony Abbott. More independent and minor-party members (seven) sat in the House than at any other contemporary election (and the national polls are no use in knowing which of these is likely to hold their seat).
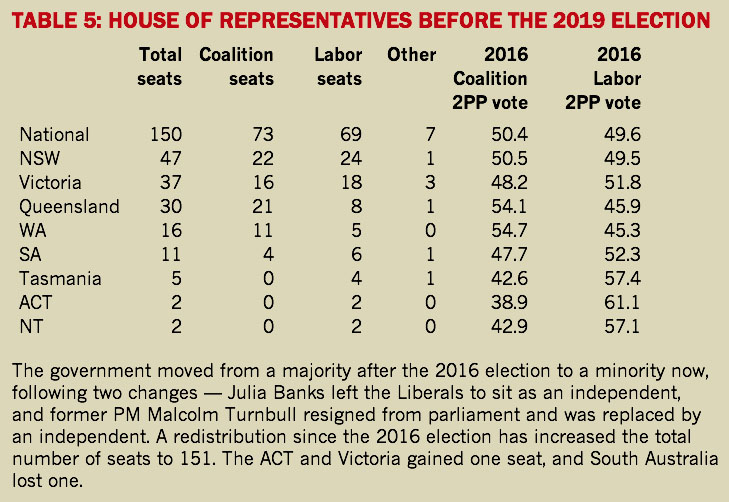
The table also shows the significant differences in support for the major parties in different states. Labor’s two weakest states are Queensland and Western Australia. In 2016 it won less than 46 per cent of the two-party-preferred vote in both states, and less than a third of the seats. On the pendulum for the 2019 election, a vote of 2 per cent against the incumbent would see a change of hands in eighteen seats (nine each for government and opposition). Eight of these are in Queensland, which accounts for why both sides are giving that state such attention.
We won’t know the impact of two unique aspects of this election until after the results are in. No other minor party has ever spent as lavishly on advertising as Clive Palmer’s United Australia Party; it will be interesting to see if these dollars translate into votes. And an extraordinary number of candidates have been forced to withdraw or have been disendorsed by their parties. Before nominations closed, nine candidates withdrew, mainly because of concerns over their eligibility under citizenship provisions in section 44 of the Constitution. Two others were replaced by their parties: the Labor candidate for Curtin had to withdraw because of her strong views on Israel; and the Liberal candidate for Corio had to withdraw seemingly for being too nice about his Labor opponent.
More importantly, an unprecedented nine “zombie” candidates appear on the voting papers. These are candidates who have been disowned by their parties after the close of nominations. The first such zombie candidate that I can remember was Pauline Hanson in 1996, who was disowned by the Liberal Party after making anti-Aboriginal comments. She probably wouldn’t have won her seat had she remained a Liberal. Among the zombies are four Liberal candidates, two Labor, and one each for the Greens, One Nation and the United Australia Party. Two are in the Senate. In none of the House seats was the disendorsed candidate favoured to win, although some were in with a chance. It is unlikely any will do a “Hanson,” but it is a strange situation nonetheless.
Both in terms of seats and two-party-preferred share (50.4 per cent), the balance of the House is very fine, and a small swing could easily see the government defeated. Labor all but equalised in 2016, so the Coalition has no scope to absorb any adverse swing.
This is the government’s second attempt at re-election, which tends to be more difficult than the first. It is harder to blame the previous government for problems, and promises sound more hollow if it looks as if the government should already have acted.
Of the five governments fighting their second attempt at re-election, four experienced marked swings against them (Menzies in 1954, Whitlam in 1975, Fraser in 1980 and Hawke in 1987). The one exception is Howard, who had been travelling badly in the polls from 1998 to 2000 but fought back in 2001, probably helped by the Tampa incident and 9/11.
Every election generates contests that may not reflect the main contest between the parties, but this election has an unusually, perhaps uniquely, high number of them. Apart from the record number of independent and minor-party incumbents, there is an unusually high number of contests where independents could either win or change the outcome. Since Malcolm Turnbull was deposed as Liberal leader, a series of independents have emerged who say they are on the conservative side of the political spectrum but want strong action on global warming. The highest-profile such contest sees Zali Steggall running against Tony Abbott in Warringah. In Victoria, (ex-Liberal MP) Julia Banks is standing against Greg Hunt, and ex-Liberal office-bearer Oliver Yates is running against Josh Frydenberg.
Several National Party seats are also likely to generate unusual contests. Former independent MP Rob Oakeshott is running in Cowper, and it will be interesting to see how the voters in neighbouring New England now feel about Barnaby Joyce. In the New South Wales election, the Nationals lost seats to the Shooters Party along the Darling River.
In other words, it’s not only the electorates that the pendulum shows as most marginal that will be interesting to watch on election night, and some unexpected results may even determine the outcome. •