How did the pollsters perform at the federal election two years ago? Which final poll got closest to the actual result? These questions might seem old hat, but the next election is less than a year away and the answers will influence how we interpret polls during the 2025 campaign, or at least the ones released in the final week — and, less importantly, what we make of surveys between now and then.
The received wisdom is that the polling industry redeemed itself in 2022 after the 2019 shocker, but that’s only half true. They picked the right winner this time, and none were too embarrassed by their published two-party-preferred numbers. But the primary-vote numbers they reported were — with one exception — nothing to brag about.
After the AEC’s count was finalised in July 2022, polling (and all-round electoral) expert Kevin Bonham conducted a post-mortem. On national polling performance, he ranked Newspoll, published in the Australian, just ahead of the Nine papers’ Resolve Political Monitor. His post, characteristically thorough, is recommended reading if you haven’t seen it already.
But I beg to differ about which outfit performed the best. I reckon Resolve did, and comfortably. It was the only pollster to have the Coalition easily ahead of Labor in primary votes. While it understated support for both major parties, it got the gap almost exactly right: three rounded percentage points against the actual 3.1. It didn’t too badly on the minor parties either (its biggest misfire was the Greens) and the independents. Every other pollster seriously overstated Labor’s primary support. Two even had the opposition slightly ahead.
This table, in rough chronological order of survey dates, tells the story. Essential is there twice, because since 2019 they’ve been leaving undecideds in. It’s common practice in American political polling but just annoying here. It means the observer has to infer numbers net of undecideds.
Calculating numbers to one decimal place from rounded figures adds to the imprecision. My aversion to doing this means that, unlike the good Dr Bonham, I’ve rounded my calculations to the nearest whole number as well. It makes little difference for our purposes.
Newspoll, Morgan and Ipsos used flows from the previous elections to allocate preferences; the latter two also provided, for comparison, two-party-preferreds provided by their survey respondents. Essential and Resolve published respondent-allocated preferences, although Resolve also noted that 2019 preference flows gave a rounded 52–48 rather than 51–49. Had they headlined the former as their official result they would have looked very good indeed — and topped Kevin’s ranking. (See his sixth point for more on all this.)
Why use the previous election’s preference flows? Counterintuitively, the record shows that plugging them in for two-party-preferred calculations — from minor party by minor party, with the independents as a group — is superior to asking respondents which of the major parties they would preference. Twiddling those flows is acceptable if there’s a good reason — if a minor party changes its how-to-vote card strategy, for example, as One Nation did between 2016 and 2019.
(It’s not totally clear why survey respondents aren’t reliable predictors of their own preferences. How-to-vote cards would play a part. More generally, a large chunk of voters simply don’t take as much care with who they rank after their primary vote. After voting “1” they don’t think the rest matters very much. Ask a person who voted for, say, One Nation or an independent which major party they preferenced, and there’s a good chance they’ll have trouble recalling.)
On election day 2022 Labor’s final two-party-preferred vote was 52.1 per cent, and the pollsters’ published predictions ranged from 51 to 54. As noted above, no egg-scraping devices required. Apart from Resolve, though, they all got lucky with the 2022 preference flows.
Now, it’s true that pollsters’ final two-party-preferred figures have usually looked better after the election than their primary-vote figures. In most cases it’s because they over/understated Greens support mostly at the expense of Labor and/or did something similar for Coalition and minor right-wing party support, particularly One Nation’s. Eighty-plus per cent of Greens preferences go to Labor anyway, and two-thirds of One Nation’s to the Coalition, so the misfires largely wash out after preferences. But in 2022 only Essential seems to have benefited greatly from this tendency.
Newspoll, Ipsos and Morgan all had 53 per cent for Labor, and from their primary numbers it’s almost certain their unrounded estimates were higher (but below 53.5). Fortunately for them, the 2019 data substantially understated flows to Labor this time around.
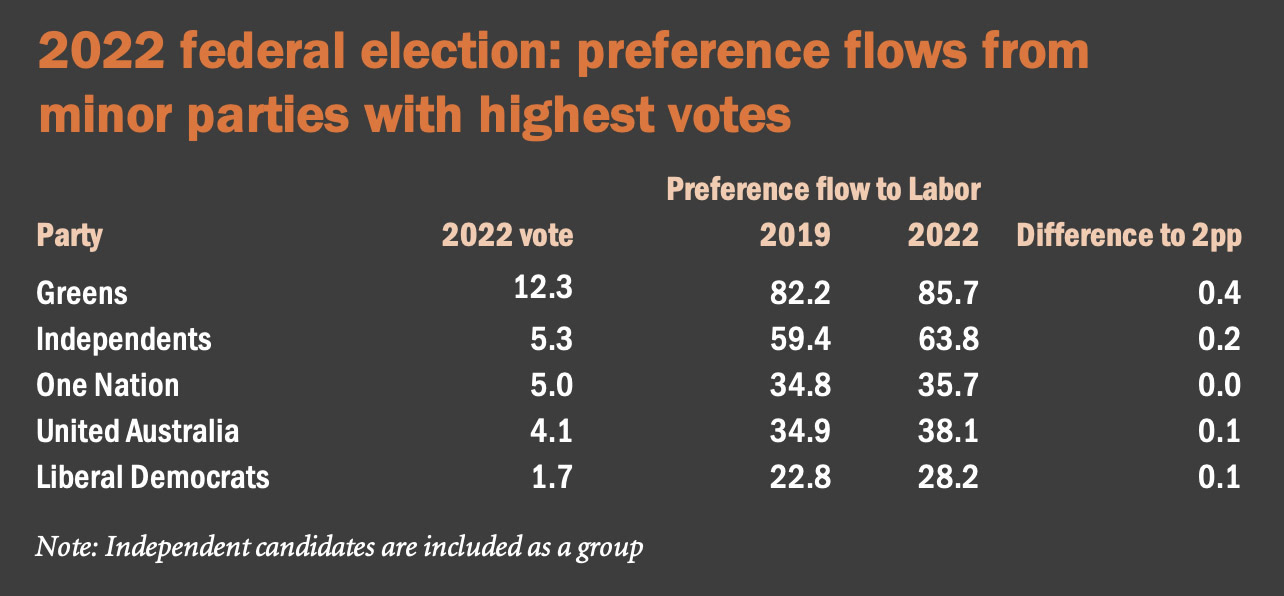
This next table includes all the minor parties (with independents as a group) that received more than 1 per cent of the national vote, in decreasing order of support. The next two columns show their 2019 and 2022 preference flows to Labor. All, as can be seen, were more favourable to Labor in 2022. (If the table had extended down to Katter’s Australia Party on 0.4 per cent, the same would have applied.)
The final column shows the difference each changed flow made to the two-party-preferred vote. They add up to 0.9 per cent (it looks like it should be 0.8 but it’s in the rounding.) Once you take account of the very long tail, minor party by minor party (where they contested in 2019), it remains at 0.9 per cent overall.
If preferences had flowed in 2022 as they did in 2019, Labor’s two-party-preferred vote would have been nearly a percentage point lower, at 51.2 per cent. (Doing it seat by seat, I get only one different outcome: Gilmore in New South Wales, won instead by the Liberal Andrew Constance.)
So pollsters who used 2019 preference flows understated Labor’s two-party-preferred vote by around 0.9 per cent. But with their primary votes much too kind to Labor, they’re very glad they did. Just to labour the point, had the pollsters (apart from Resolve and Essential) known how preferences would actually flow, they would have published figures one percentage point higher.
Now, I am not here to pump Resolve’s tyres. Its founder and owner, Jim Reed, used to work for the Liberal-aligned Crosby-Textor, and it sometimes shows in the wording of the company’s surveys on political issues. This tendency reached a possible nadir when in 2021 the Morrison government test-ran a slogan against the Labor opposition on climate change policy, claiming the Coalition would meet its targets using “technology, not taxes.” Resolve dutifully presented its respondents with the same false dichotomy: “which is your preferred method for Australia to reduce its carbon emissions?… Put a cost on emissions or use new technologies?” and unsurprisingly found a big majority favoured the pain-free option. As Murray Goot wrote in these pages, the question “could have been written in the prime minister’s office.”
There’s another thing: while every pollster pulls out all stops for their final-week polls, usually by using larger samples, Resolve changes its methodology, adding telephone interviews to its online ones. Its earlier 2022 campaign result — late April, online only — was bang in the centre of the polling pack: Labor one point ahead on the primary vote, 54 per cent after preferences. Apart from the final campaign poll, there is no reason to prioritise them over the other pollsters.
Nor am I one to claim that the national two-party-preferred figure no longer matters much. Proponents of this view invariably argue that aggregate two-party-preferred numbers can’t account for contests in seats where the two major parties aren’t head-to-head (of which we saw a record twenty-seven in 2022, sixteen of them won by a minor party or independent). This is true, but it applies equally to national primary votes. And if that’s the case, why bother with national polling at all?
With major party support continuing its bumpy road downwards, a time will come when national votes, primary and two-party-preferred, are virtually meaningless. But we sure ain’t there yet.
The final table is essentially the same as the first but plugs in the 2019 and 2022 preference flows for each pollster. Rather than just add them to the pollsters’ rounded numbers, I’ve also given a range for each from lowest possible to highest.
In Morgan’s case, for example, the lowest possible Labor two-party-preferred figure comes from assuming the Coalition is actually on 34.49, Labor is on 33.5, Greens 12.5, One Nation 4.49, United Australia 1.49, independents 8.5 and others 4.5. You have permission to skip this table: its main purpose is to show that calculations from rounded primary support produce a range; you could call it another “margin of error” that needs to be acknowledged.
What does all this mean for the final week of the 2025 campaign?
After the 2019 polling disaster, most major firms performed public navel-gazing and at least implicitly promised to do better. Not so after 2022, but we must hope that all of them (Resolve aside) have quietly introspected about their too-high Labor primary support. In the past six months or so they have certainly produced a lot of low figures, lower and more numerous than in the whole previous term. (See Wikipedia in 2019–2022 and 2022–2025.) If they haven’t mended their ways, you can take a couple more points off Labor’s currently polled two-party-preferred.
And of course, the new gold standard is to use preference flows from the previous election, in this case 2022. But can we assume those record high preference flows (mostly from the Greens) will be repeated next year? If, for example, they revert back to 2019 levels, then we can knock a point off Labor’s published two-party-preferred support in about nine out of ten polls. On the other hand, maybe preferences will favour Labor even more next year.
Without a good reason not to, we must use 2022 flows… I suppose.
Anyway, in that final week I’ll be hanging out for Resolve’s poll — their primary numbers and, if they supply two-party-preferred estimates by past election vote, those as well. Then we’ll see if it was a fluke. •
