The numbers from the 2025 election are not yet final — as I write this, the AEC has counted just over 75 per cent of votes — but we do know that the pollsters’ figures all fell on the right side of the line: they each had Labor ahead, and Labor went on to win. After the debacle of 2019, when they all fell on the wrong side of the line, that’s a mighty relief not only to the pollsters but also to Labor.
On closer inspection, however, three things considerably less reassuring also stand out. First, the final polls — ten of them from ten different market research firms — underestimated Labor’s share of both the two-party-preferred and the first-preference vote. There was a disturbing parallel to 2019, when every poll (five on that occasion) overestimated Labor’s two-party share and its share of the first preferences.
As of Sunday evening, Labor had received 54.9 per cent of the two-party vote and nearly 35 per cent of the first preferences; after election night, Labor’s official two-party-preferred vote had fallen back, though its first-preference vote had increased. On both measures, the least accurate of the polls was Ipsos: it underestimated Labor’s two-party vote by 3.9 percentage points and Labor’s first-preference vote by nearly seven points (see table). On the two-party preferred, the most accurate polls were Freshwater, RedBridge/Accent, Spectre, and Resolve; all underestimated Labor’s share by 1.9 points, though this number will narrow. On first preferences, the most accurate poll was YouGov.
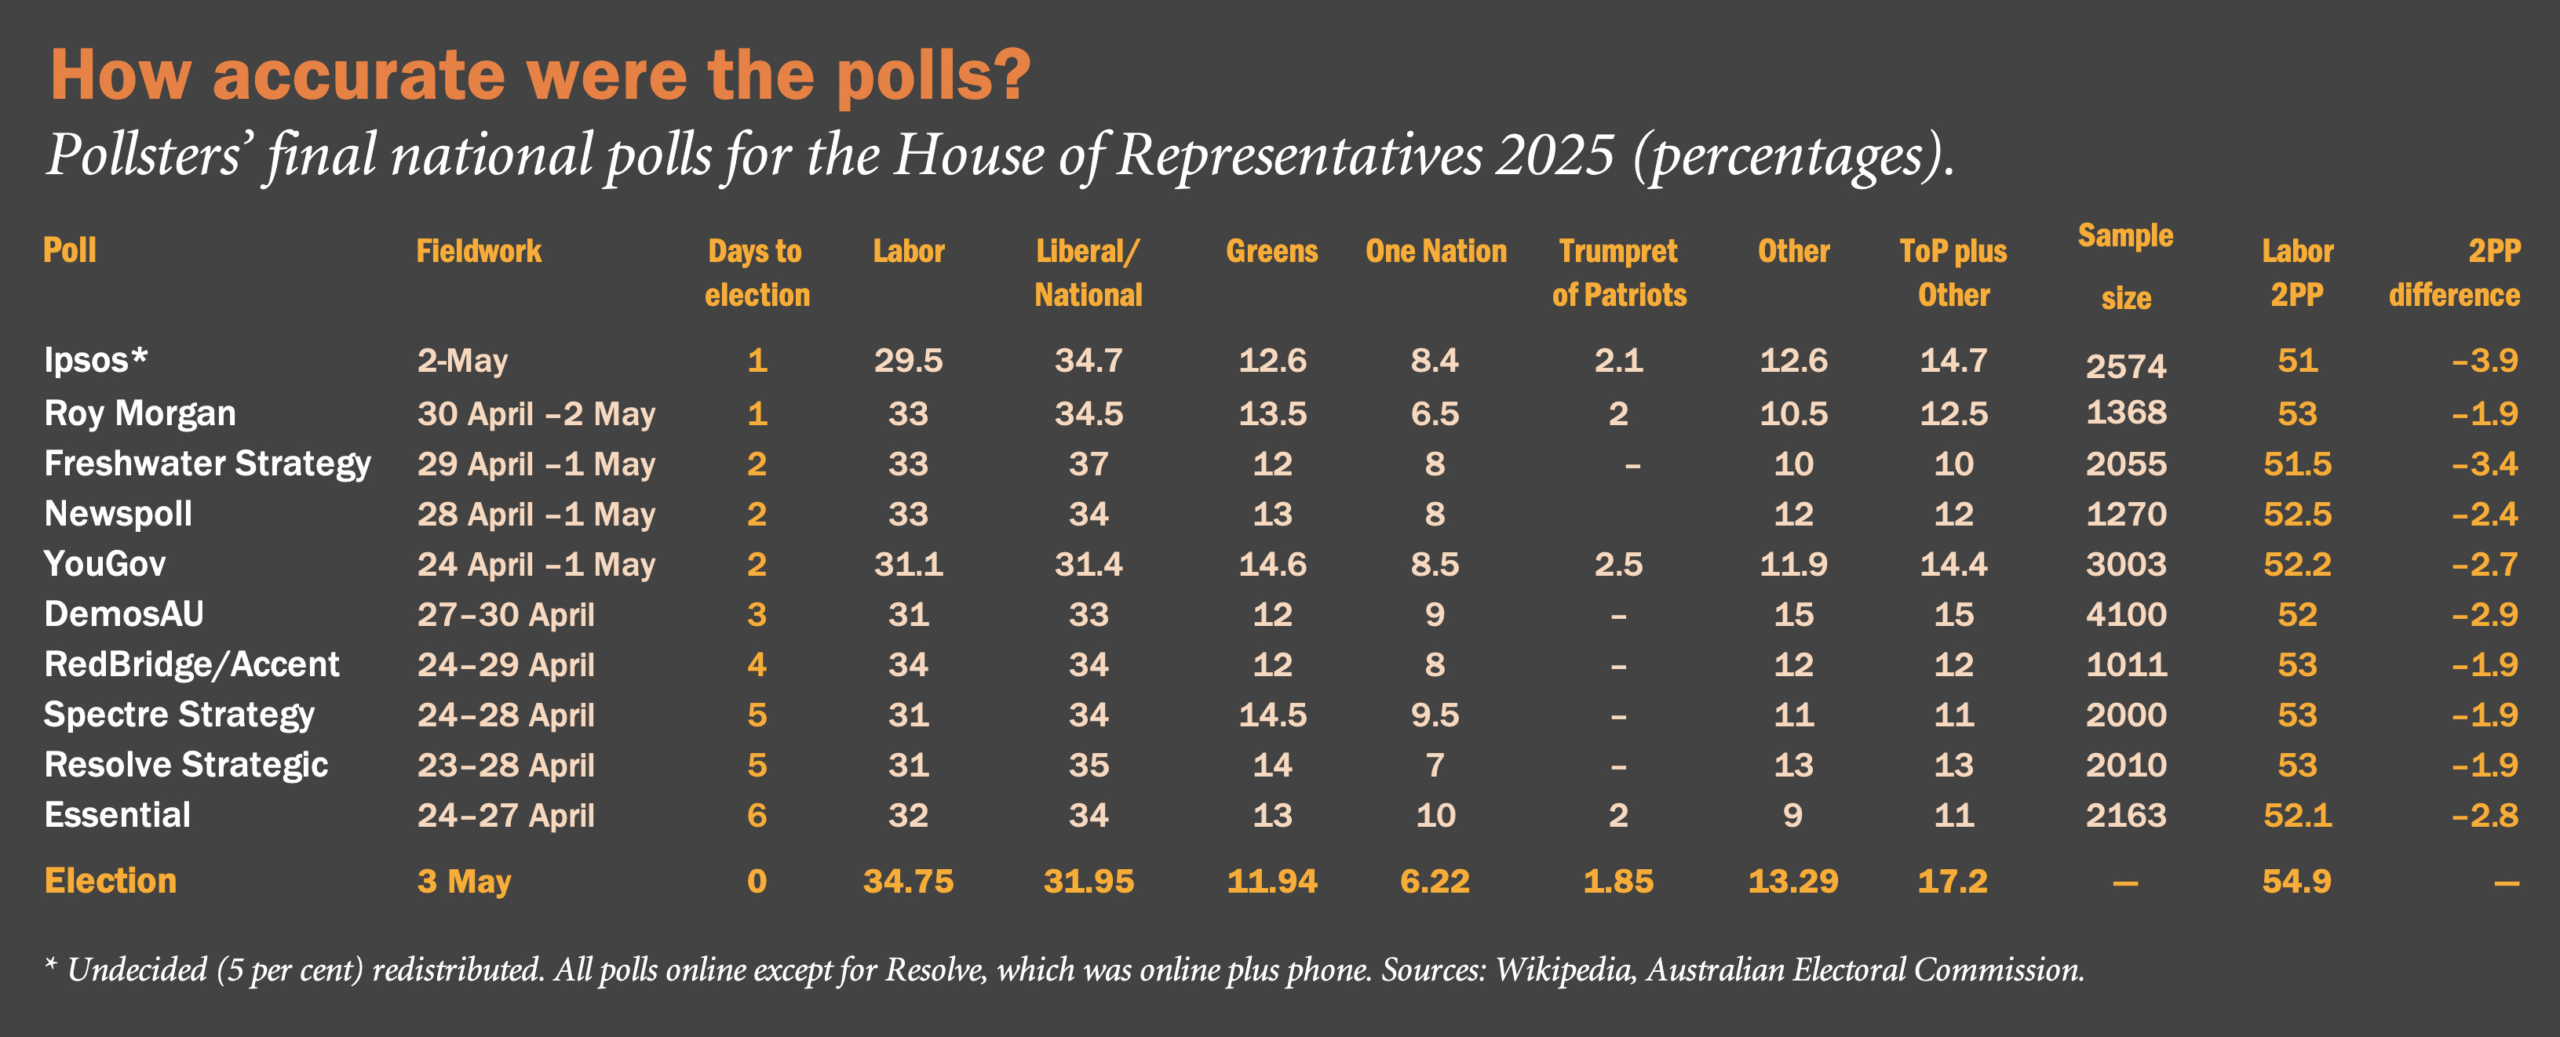
Equally conspicuous was the polls’ overestimate not only of the Coalition’s two-party share (a corollary of its underestimating Labor’s share) but also the Coalition’s share of the first preferences. While the Coalition appears to have won around 32 per cent of the first preference vote, Freshwater (a pollster the Liberals used) had the Coalition on 37 per cent; six other polls estimated the Coalition’s first preference vote at between 34 and 35 per cent; and only one poll (YouGov, 31.4 per cent) came close to the real figure.
The overestimates for the Greens and One Nation and underestimates for “Others” (the combined vote for the remainder) are also noteworthy. For the Greens, on track to pick up about 12 per cent of the vote (slightly lower than last time), estimates ranged from 12 per cent (Freshwater, DemosAU, RedBridge/Accent) to 14.5 (Spectre) or 14.6 per cent (YouGov); no pollster appears to have underestimated it. On One Nation, which will pick up around 6 per cent of the vote (an increase from 5 per cent last time), estimates ranged from 6.5 (Roy Morgan) to 10 per cent (Essential).
Support for all the other parties (including Trumpet for Patriots, and Katter’ Australia Party) and for the independents (including the community independents, or teals), currently running at over 17 per cent, was universally underestimated: Freshwater’s estimate (10 per cent) was the lowest; DemosAU’s (15 per cent), the highest.
While the pollsters themselves will have their thoughts on why their figures didn’t line up with the actual result, there are explanations we can put to the test and others they may prefer we don’t.
It could be that there was a late change — that sentiment moved away from the Coalition (and perhaps the Greens) in the last day or so and towards Labor (and perhaps to Others). No doubt, as the pollsters kept saying, voters were “disengaged,” a substantial proportion of the vote was “soft,” and many made their decision on election day — indeed, inside the polling booth as they held the pencil in their hand. The problem with this explanation is that those who conducted their polls relatively late in the piece — five of the polls were only completed a day or two before Saturday — were no more accurate than those who completed their polls three to six days out.
The preference flow the pollsters applied may also have been at odds with the flow of preferences on the day. But though this might tell us something about the underestimate of Labor two-party-preferred, it tell us nothing about the pattern of estimates for the first preferences.
The source of the problem almost certainly lies elsewhere. One possibility is what survey researchers call “coverage” — failing to draw a sample in such a way as to include all of those who should be included. All the pre-election polls were online polls (Resolve supplementing theirs with some telephone interviews), dependent on databases that include only a fraction of those with access to the internet and that exclude, by definition, those without access (estimated to be about 15 per cent of the electorate).
Another source of error is sampling variance or “sampling error”; this is the famous “±3.2 per cent,” or whatever, that market researchers or journalists like to hold on to as a sort of security blanket, a number that tells you that 95 per cent of the time the figures will be correct to within a few percentage points. Alas, since none of the polls used probability sampling, where every member of the relevant population is given an equal (or at least known) chance of being selected, “sampling error” doesn’t really apply.
But what if the polls had been based on probability samples, and this measure of sampling variance did apply? Then we would expect to see a very different set of numbers. If sampling variance were the real explanation, then instead of every one of the estimates for Labor’s two-party vote falling short of the number recorded in the tally rooms, we would expect to see some estimates that undershot the true figure, some that were spot-on, and — most importantly — some that overshot the real number. It’s the limited range, or lack of “dispersal”, in the published polls — the absence of any estimate of 54 or 55 per cent or more — that tells us that sampling variance is not the answer.
One other source of error worth thinking about here is non-response error. This occurs when those approached for an interview or asked a particular question ignore the invitation or don’t answer the question. Getting young people, for example, to respond is one problem. Getting people who aren’t interested in politics to respond may be another. If non-respondents have very different political preferences from those who do respond, then all the polls — not just some of them — are courting trouble.
There are darker possibilities. One, is “herding” — the deliberate choice by some pollsters to adjust their results so that their polls look like most of the other polls in the field — not identical, but very similar. That way, if they get it “wrong” — especially on the much-watched two-party vote — they will be in (good) company and won’t stand out; in 2019, one pollster confessed he had withheld a poll because he didn’t want to take the risk of being the one to get it “wrong.” The risk, of course, is that by not publishing their “outlier” they forfeit the chance of reaping the glory when everyone else gets it wrong.
While speculation about herding is increasingly common — encouraged by the polling industry’s lack of transparency — it’s important not to jump to this conclusion too quickly or think this might be the only cause. It’s not necessarily the only, or most obvious, reason for the pattern that emerged this time around.
Moreover, while herding is typically invoked to explain commonalities in estimating the two-party vote rather than primary support, what we are seeing here are uniform errors in estimating first preferences — Labor, the Coalition parties, the Greens, One Nation, and Other.
The answers to the problems posed by the poll results in this election may well lie in finding more comprehensive (or at least more representative) online databases; or failing that, using mixed modes (as Resolve may have done). It might also lie in finding the resources to tackle the problems of non-response.
As the final votes are counted, invoking “late swing” may persuade some but to the rest of us it shouldn’t bring much comfort. •