What is the best way of working out whether Labor or the Coalition will win next month’s election outright — or, failing that, which will be better placed to form government? The polls offer two distinct narratives, one based on the national two-party-preferred vote and the other on seat-by-seat two-candidate-preferred swings. Both could be right; both could be wrong; one could be right, the other wrong.
In its purest form, the national narrative rests on the belief that voters are driven by concerns broadly shared across all seats — concerns about the cost of living or defence, for instance — and which side will better deal with them. The major parties make their pitch to various demographics — women, young voters, working families, and so on — not because these voters are necessarily concentrated in some electorates more than others, but because the numbers are large, and these voters are everywhere.
Campaigning is about informing voters about the parties’ policies, with different policies emphasised in different electorates; it is not about “announcables” tailored to advantage this electorate or that. In campaigns said to be increasingly presidential, the alternative prime ministers compete in the media to “win” the day or the week.
Central to this narrative is the electoral pendulum. In 1972, when political scientist Malcolm Mackerras published the first pendulum, every seat was held by a Labor, Liberal or Country Party member. In the latest pendulum, produced by the ABC’s Antony Green, not all the seats are listed — only the 135 (out of 150) held by the government or opposition — and of these only the results where the final count is expected to be between Labor and the Coalition are expressed in terms of a two-party preferred (124).
The pendulum arranges every seat by how “safe” it is, with Labor seats on one side and Liberal, National and Liberal National Party (Queensland) seats on the other. In the Australian Electoral Commission’s terminology, seats held on a two-party vote of 60 per cent or more are “safe,” seats that would change sides with less than a six-point swing are “marginal,” and those in between are “fairly safe.”
Given a swing of certain size averaged across the nation, the pendulum purports to show each side’s net loss or gain. Of the 124, thirty-eight (nineteen Labor, nineteen Coalition) or nearly a third, are “marginal.” Exactly which seats would change the pendulum doesn’t predict. But it encourages the view that marginal seats need a good deal more attention than safer seats if parties are to confound its logic. Since shifts in the vote are never uniform, swings in different directions are expected to cancel out, with unexpected losses matched by unexpected gains.
The contrasting narrative rests on the two-candidate-preferred vote in each seat, regardless of who the final two candidates are. It gains extra force from the fact that, increasingly, at least one of the final two candidates in individual seats has been neither Labor nor Coalition. In 2022, twenty-seven of these “non-classic” contests took place; in 2025, Antony Green expects twenty-eight, or roughly one seat-in-five. Increasingly, seat contests appear to be sui generis. It might well seem, as former US House of Representatives speaker Tip O’Neill famously said, that “All politics is local.”
In these circumstances, the idea of a single pendulum looks more and more dated. Instead of one pendulum, Green invites us to consider no fewer than six: one that includes every seat held by Labor or the Coalition, two-party-preferred or two-candidate-preferred (135); another listing seats held by independents and Greens (fifteen); and four others — in Labor seats threatened by The Greens (seven), Green or independent seats threatened by Labor (six), Coalition seats threatened by independents (six), and independent or Greens seats threatened by the Coalition (twelve).
But it’s doubtful that pendulums covering non-classic contests are pendulums in anything other than name. There is little reason to think that an overall shift in support for Greens or for independents, nationally, would predict a change in the number of Greens or independents in parliament; to date, their successes have been highly localised. To generate a series of pendulums more attuned to the varying nature of the seat-by-seat contests risks turning what was designed as a simplifying device into something unduly complicated and contrived.
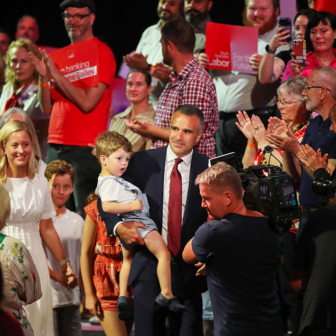
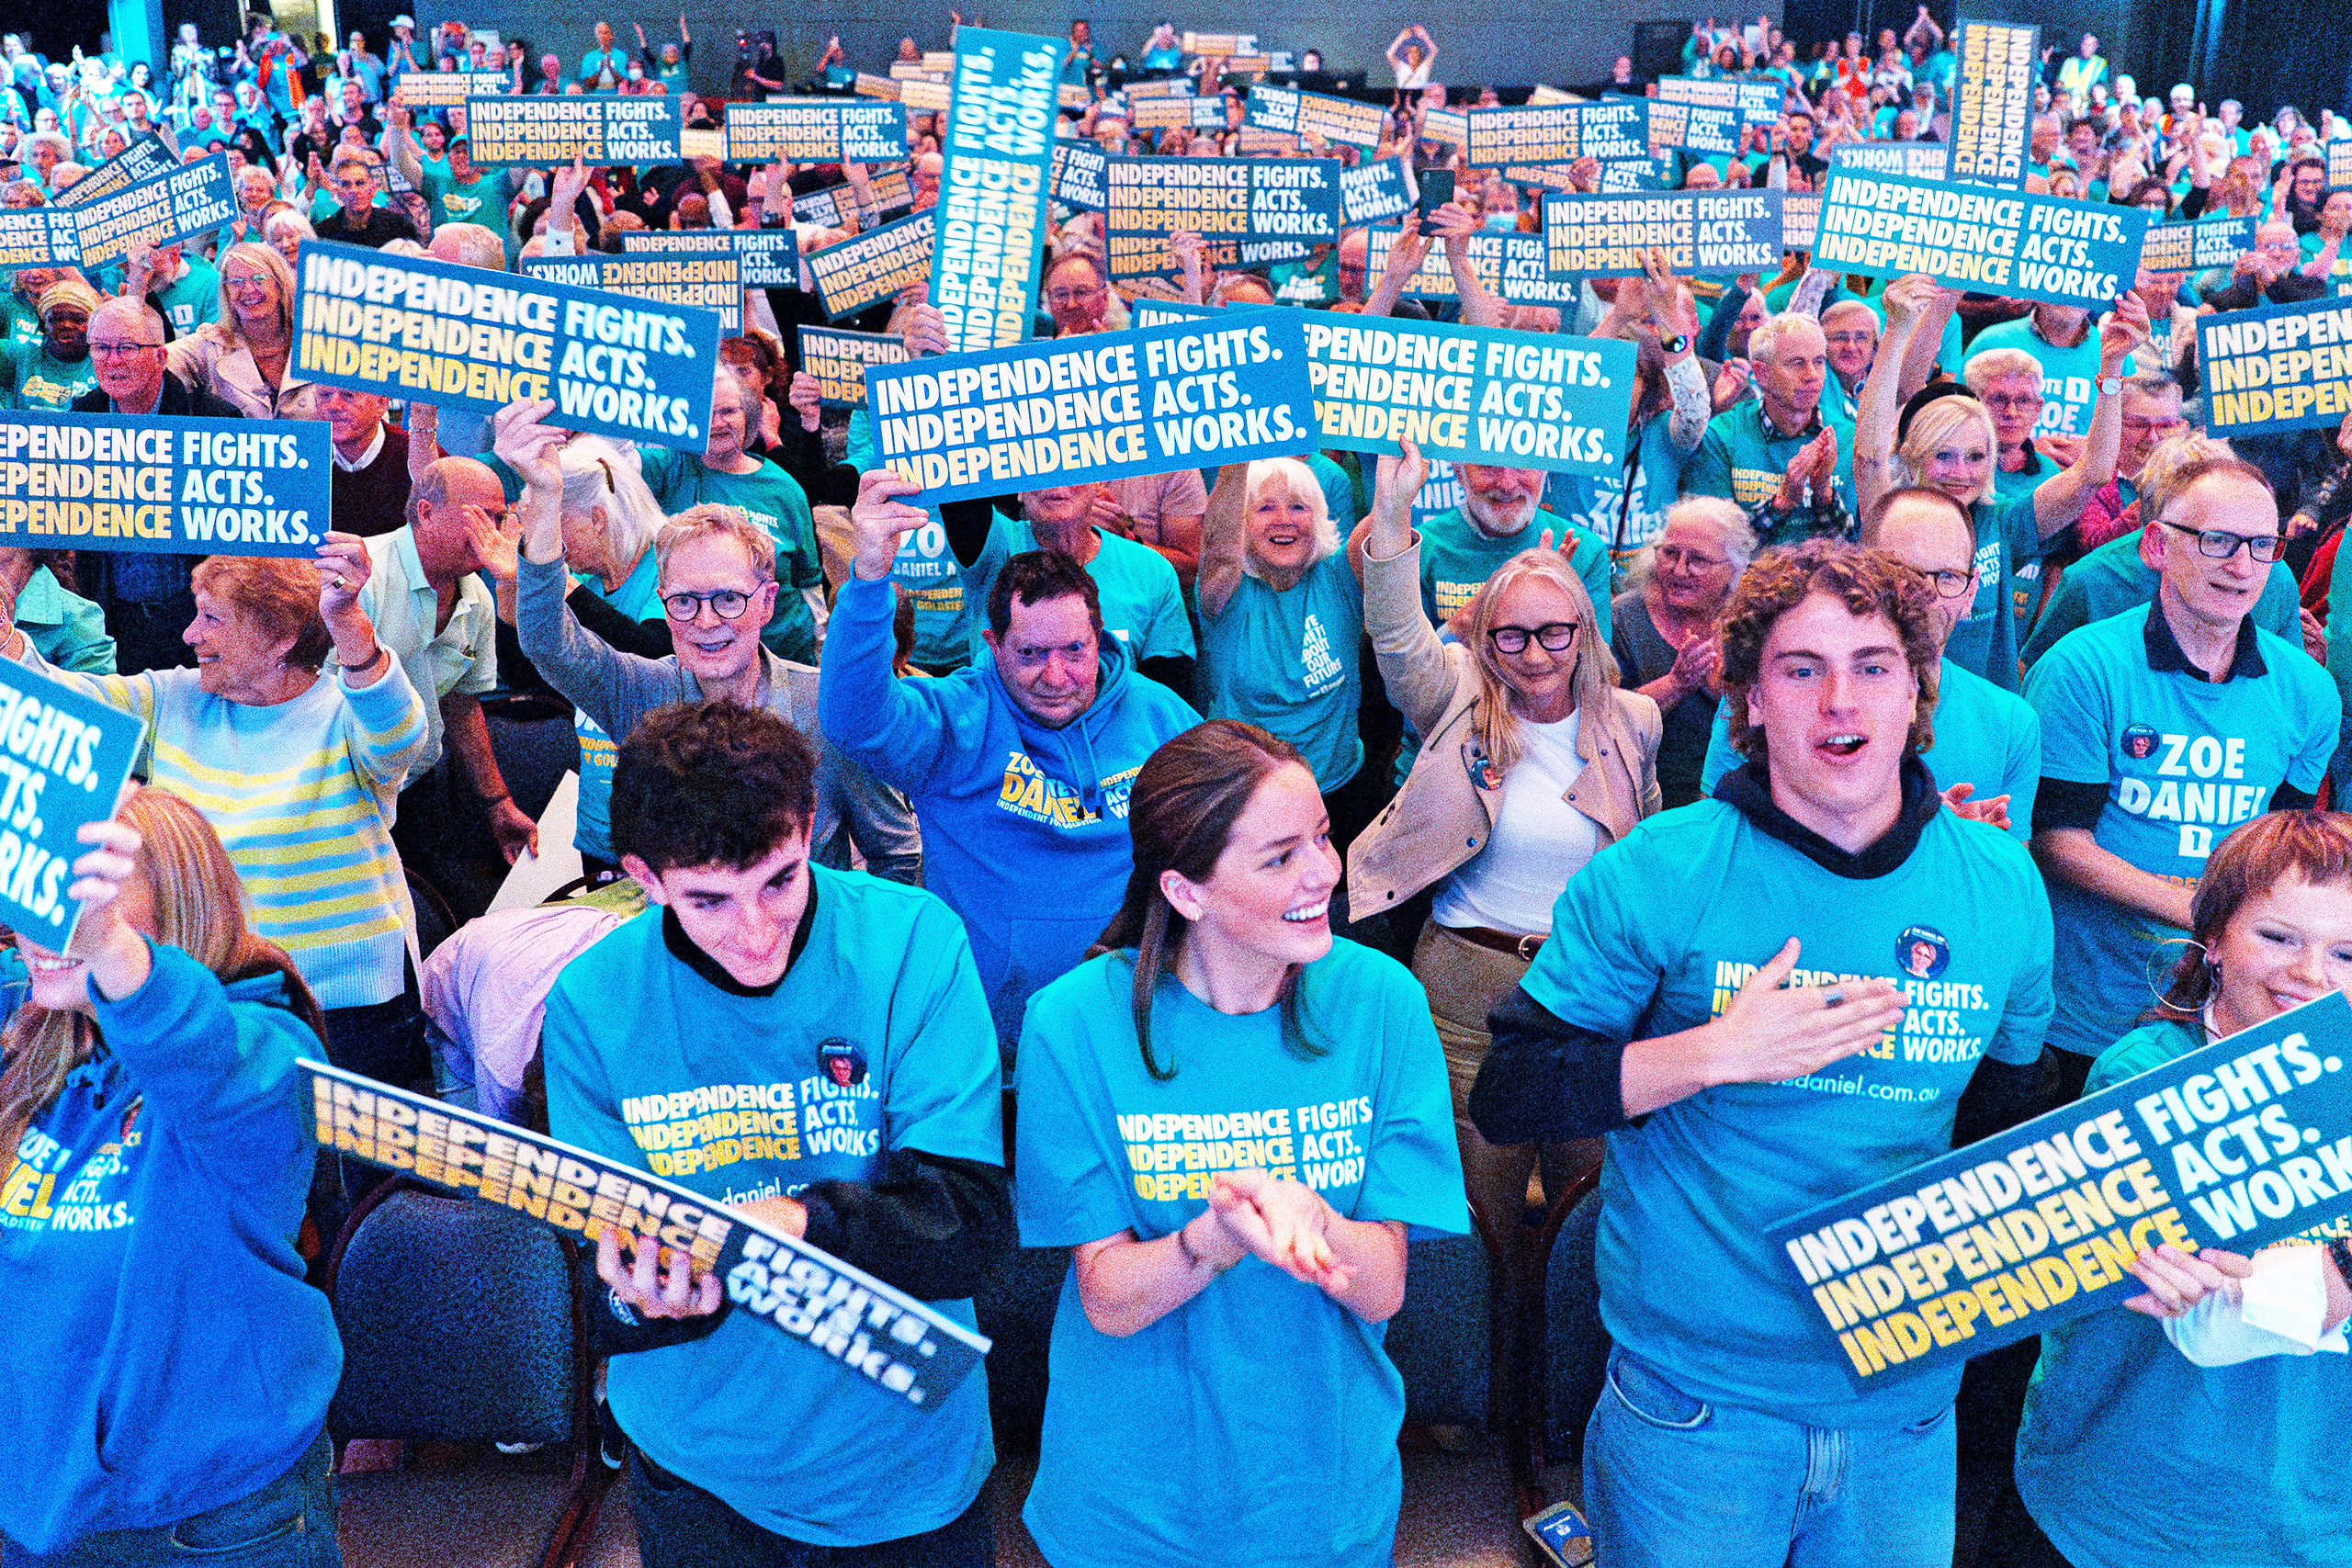
The narrative of the two-candidate-preferred rests on the idea that no seat is a safe seat. In 2022, the success of the teals in six formerly Liberal seats — the largest rout of any party of government since the Second World War — gave this view of electoral politics a big boost. Two of the seats, Mackellar and Curtin, had been “safe” seats; Warringah, first won by Zali Steggall in 2019, had also been “safe”; Indi, in 2013 the first success for “community independents,” had been held by the Liberals with almost 60 per cent of the two-party vote.
What puts a “safe” or “fairly safe” seat “at risk” varies. An issue of public policy, especially salient in that seat, may be one reason. At this election, for example, the government’s policy on the war in Gaza is likely to be of concern to the large number of Muslim voters in Labor seats in Melbourne (Calwell especially) and Sydney (Watson and Blaxland especially) and to Jewish voters in Labor seats, especially in the Melbourne seat of Macnamara.
Contests may also depend on what the parties promise to do locally. Nowadays, much of the election campaign consists of the leaders visiting one electorate or another — some more than once — to announce a piece of local infrastructure they think will make a difference. The Daily Telegraph has long published a daily “pork-o-meter” and Crikey has rolled out a “Big Pork Barrell map.” Whether these bribes work is an entirely different matter.
In this narrative, the election is not a single contest but up to 150 different contests. It’s a narrative for the times: witness not just the rise in “non-classic” contests but the failure of the main parties to see these challenges off.
In postwar elections, until 1990, only one independent or new party ever won a seat in the House of Representatives. This changed — slowly, then dramatically. From 2010 to 2019, the number of seats the major parties didn’t win ranged from five to eight. In 2022, when the number of seats won by Labor or the Coalition without going to preferences collapsed, they missed out on eighteen. In only 15 per cent of the seats did Labor or the Coalition win more than half the primary vote; in 2016 (48 per cent) and 2019 (46 per cent) the figure had been close to half.
Still, while the number of seats won by the parties of government has declined, only once has this forced the winner to govern in minority: in 2010, when the two sides were tied, 72–72. In 2016, when the Coalition won just seven more seats than Labor, and in 2019, when the margin was eight, it governed in its own right despite the presence of other parties and independents in the chamber. In 2022, not even a crossbench of eighteen was enough to force Labor into minority government: it had won nineteen more seats than the Coalition. A closer two-party contest on 3 May could prove a different matter.
MAPPING THE NARRATIVES ONTO THE POLLS
The two-party-preferred figure was the focus of the three most-watched pollsters when they published results within days of the election being called on 28 March: Newspoll, conducted 27–29 March for the Australian; the Resolve Political Monitor (26–30 March) for the Sydney Morning Herald and the Age; and the Freshwater Strategy poll (28–30 March) for the Australian Financial Review. It was also a feature of the Essential poll (26–30 March), published online and by the Guardian; the Accent/RedBridge poll (28 March–1 April), published online and by News Corp’s metro mastheads; and the polls published online by Roy Morgan (24–30 March) and YouGov (28 March–3 April). (The results of all these polls can be found here.)
The state of play in individual seats — focused on the two-candidate-preferred figures — is the centrepiece of YouGov’s other recent poll, its large (10,217-strong) MRP (multilevel regression with post stratification) poll, which reports individually on all 150 seats. Completed on 27 February–26 March, shortly before the election was called, it was published both online and by ABC’s Insiders.
Several other polls were also conducted before the election was called in individual seats or groups of seats — seats held by the teals or the Greens. Most were paid for or published by groups keen to see teals and Greens defeated. One set of polls was conducted by Insightfully (on undisclosed dates) for Advance (a campaigning organisation on the right) in Ryan, Griffith and Melbourne (seats held by Greens but threatened by the Liberals and/or Labor) as well as in Wills and Macnamara (where Labor is threatened by the Greens and/or the Liberals); selected results were released to James Campbell, News Corp’s national weekend political editor. Another set was conducted by Freshwater (5–7 March), for the Daily Telegraph, in Curtin, Goldstein, Kooyong, Mackellar, Warringah and Wentworth — all seats held by teals. A third set was conducted by JWS (12–13 March) — again, in Goldstein and Kooyong, for Australian Energy Producers, and the results released to the Herald-Sun.
These seats or others where independents or Greens are likely to do well have also attracted the attention of campaigners on the left. The Australia Institute polled Sydney (17–18 March) and Climate 200 polled Goldstein (18–25 March). Both polls were conducted by uComms. Polling commissioned by Climate 200 from uComms in Bradfield and Monash led to allegations of “push-polling” but figures from the poll were not published.
The national vote: According to most of the national polls, the race has “tightened.” The Coalition’s two-party lead over Labor has narrowed if not disappeared — or Labor is now ahead and increasing its lead. Even where Labor is behind, it remains better placed to form the next (minority) government. If, as some polls suggest, Labor is now in position to be re-elected with a working majority, then the race hasn’t tightened; on the contrary, Labor has drawn further ahead.
Once the election was called, Resolve reported the biggest shift in support. It had Labor and the Coalition either split 50–50, based on how respondents said they would allocate their preferences (versus 45–55 on 18–23 February), or Labor with “a narrow lead,” 51–49, based on “the way they flowed at the last election” (versus 48–52 in February). If the first allocation of preferences suggested a shift to Labor (and a corresponding loss by the Coalition) of five percentage points, the second set suggested a shift to Labor (and away from the Coalition) of not much more than half that, three points.
Which of the two was more likely to be correct neither Resolve nor David Crowe (who reported the results for the Nine papers) seemed prepared to say. Most pollsters would have chosen the way preferences flowed in 2022. The shift from 45–55 (February) to 50–50 (March) is difficult to credit. A “shock poll” is how the Sydney Morning Herald headlined the February poll. Compared with all the other polls conducted at the time, it was an outlier.
Had the level of support for Labor improved by even three points, converting a four-point deficit (48–52) to a two-point lead (51–49)? This, too, seems unlikely. Key to the change was an apparent improvement in Labor’s primary vote, from 25 per cent in February to 29 per cent in March; in 2022, Labor secured 32.9 per cent of the first preferences. The February figure was almost certainly wrong. No other poll taken in February reported a figure for Labor less than 28 per cent. (Ahead of the 2022 election, Resolve was the only pollster to underestimate Labor’s first preferences.)
According to Newspoll, Labor’s position had improved in three polls conducted between 20–24 January and 3–7 March from 49–51 to 51–49, a shift of two points made more dramatic as a news story because it reversed the Coalition’s lead. For the Australian’s headline writer, “Labor Seizes Lead” was confirmed by the level of satisfaction with Peter Dutton’s performance as opposition leader, also “drift[ing]” up by two points, and the gap between Dutton and Anthony Albanese as the person who would make “the better prime minister” increasing by two.
In its most recent poll (31 March–4 April), Labor’s lead has improved to 52–48. Since Newspoll is the acknowledged market leader — no poll has a better record at predicting Australian elections — it is likely to be a price setter. It is easy to imagine pollsters looking at Newspoll’s results before releasing their own. Elections are marketing opportunities, and unless a poll is deemed the most accurate on the day there is more to be lost being on your own than being wrong with the rest of the pack.
For Accent/RedBridge, 52–48 (28 March– 1 April) and YouGov, 51–49 (28 March–3 April), Labor’s two-party vote, measured after the election was announced, has improved by just one point. In the Essential poll (48–47, with the other 5 per cent unallocated), Labor’s vote had also improved by one point — though over the previous fortnight rather than the previous week.
On Freshwater’s reckoning, however, nothing had changed in the previous fortnight: behind 49–51 in early March, Labor was still behind 49–51 (49.4–50.6, to be more exact) in late March. Nor had there been a change in the weekly Morgan poll, steady on a much less plausible 53–47; only later would it move to 53.5–46.5 (31 March–4 April).
For the Guardian, a team of data scientists has been combining all the polls and adjusting for three factors: sample size, previous results (excluding election predictions but including their consistency since 2022) and party bias (or “house effects”). Their 10 April modelling puts Labor nearly one point behind the Coalition, 49.6–50.4, rather than ahead (as five of the seven polls indicate). Within a confidence level of 95 per cent, Labor’s two-party preferred is somewhere between 48.0 and 51.3 per cent and the Coalition’s between 48.7 and 52.0 per cent.
And the track record of the Guardian’s data scientists? In 2022, similar modelling undertaken by Luke Mansillo (now part of the Guardian team) predicted a two-party vote of 53.5–46.5 — an overestimate of Labor’s vote by 1.4 points. Though the estimate was well within the bounds of the model, a similar overestimate this time would mean the true figure for Labor would not be 49.6 but 48.2 per cent — a swing away from Labor of 3.9 points, three times the size of the swing of 1.3 points derived from a simple averaging of the polls.
Another model, this one from political scientist Simon Jackman, has Labor on 51.5 per cent — much more in line with what the polls themselves are showing. His modelling includes house effects, constant over time, that “‘cancel out’ (or sum to zero) across the included pollsters.” AI models that consider a wider range of factors (though probably not house effects) make similar predictions.
If, as the formal campaign got underway, Labor was behind and has been trailing ever since, is it trailing by a smaller margin? In the Guardian’s model, scarcely. Its estimate of the Coalition’s two-party vote for 8–12 March was 49.5–52.3 per cent; for 13–26 March, 49.4–52.1 per cent; for 27 March–1 April, 49.3–52.4 per cent; and for 2–8 April, 49.6–50.4 per cent. In short, it’s back to where it was four weeks ago.
If, on this modelling, Labor has suffered a two-party swing of 2.5 points since 2022, what might this mean in terms of seats? Based on the pendulum, Labor would suffer a net loss of five seats, taking it from seventy-eight seats to seventy-three and the Coalition from fifty-seven to sixty-two. While Labor would have to find three members of the crossbench to support it, the Coalition would need to find fourteen. A 50–50 split (one reading of the Resolve poll) would mean a net loss for Labor of four seats; a 51–49 split (another reading) would mean a net loss of just three, leaving Labor able to govern after enticing someone — probably an independent — to become the speaker.
A 52–48 split (recorded by Accent/RedBridge and the latest Newspoll) would leave Labor’s current majority unchanged or give it an extra seat. A 52.5–47.5 split (YouGov) would see Labor with a net gain of three. Morgan’s 53.5–46.5 split would see Labor with a net gain of six.
If Resolve’s 45–55 split in February would see Labor lose by the biggest margin since its massive loss to the Coalition in 1977, YouGov’s 52.5–47.5 and Morgan’s 53.5–46.5 would see Labor become only the second government since Federation to attract a higher vote (and parliamentary majority) at the end of its first term. (The first was the Bruce–Page Nationalist–Country Party government, first elected in 1922 and re-elected in 1925.)
Seat by seat: In YouGov’s MRP, run from 27 February to 26 March, Labor’s two-party vote was 50.2, the Coalition’s 49.8; in its earlier MRP (22 January to 12 February 12), the split was 48.9–51.1. “Polling will likely continue to be tight,” YouGov predicts. But the two-party figures — “a blend between what our thousands of respondents are telling us themselves about how they will number their ballot, and historic flows between parties at previous Australian elections” — were not what interested poll-watchers or grabbed the attention of the ABC.
What made this poll interesting was that, in addition to reporting the two-party preferred, YouGov reported a two-candidate vote for each of the 150 seats. This allowed it to say which seats would change colour — and how many would become red, blue, green, or teal. By this reckoning, the Coalition would gain six seats — Bennelong, Gilmore, Werriwa and Robertson (NSW), Aston (Vic) and Lyons (Tas); Labor would gain Deakin (Vic) from the Liberals plus Griffith and Brisbane (Qld) from the Greens; and the Coalition would lose two (Cowper, NSW, and Wannon, Vic) to independents.
Overall, Labor would lose three seats, taking it to seventy-five and the Coalition would gain three, taking it to sixty, a result little different from what the pendulum might lead us to expect on the basis of a swing of 1.9 points: a loss/gain not of three seats but of four.
It’s true that YouGov’s estimate of the likely result came with caveats: Labor’s seat share (seventy-five) was estimated to be in the range sixty-nine to eighty; the Coalition’s seat share (sixty), in the range fifty-five to sixty-eight. But polls that simply reported an overall two-party-preferred vote also come with caveats: the ubiquitous plus or minus percentage allowed for “sampling error” (though not being based on truly random samples, none of the polls’ sampling errors can be estimated).
Compared with YouGov’s earlier MRP, when support for Labor was 1.3 points lower, had there been a shift towards Labor across most electorates, as the two-party narrative might lead us to expect? Or were the shifts all over the place, as we might expect if we were witnessing 150 separate elections? The shifts were largely towards Labor. Across the 133 seats where Labor candidates were expected to figure in the final count (overwhelmingly two-party contests), support shifted towards Labor in no fewer than ninety-three (69.9 per cent); in only fifteen (11.3 per cent) were there swings against Labor, the remaining twenty-five (18.8 per cent) registering no swings one way or the other.
As pendulum-watchers would expect, every seat called as a Coalition “gain” was a Labor marginal held on margins of between 0.04 (Bennelong, notionally Labor) and 5.3 (Werriwa). In the other fourteen seats held on margins of 5.3 or less, Labor was either even with the Coalition (McEwen) or ahead and expected to hold on — notwithstanding the fact that many of these leads were very small (certainly, within the “margin of error”); in three seats (Paterson, Chisholm, and Reid) Labor was ahead by only 51–49. That Labor might pick up Deakin (held by the Liberals by the smallest of margins, 0.02), YouGov described as “surprising.” But to have seats change hands both ways is hardly surprising; since 1972, it’s happened twelve times out of twenty.
Not shown as switching were any of the seats where the Middle East conflict might leave a mark. In Watson (where the MRP says Labor leads 57–43), Blaxland (56–44) and Calwell (55–45) the two-party gap has narrowed since the last MRP. In Watson, Labor had led 60–40, in Blaxland and Calwell, 58–42 — but YouGov continues to describe both as “safe Labor.” It continues to describe Macnamara (60–40), where Labor has improved its position (it was previously ahead 58–42), as “likely Labor.”
On these figures, neither Muslim nor Jewish voters will come even close to changing the outcomes. But, as YouGov concedes, “we cannot reliably capture every local factor specific to every single seat.” It makes no allowance for an electorate’s religious makeup. It does not factor in the number of Indigenous voters in an electorate such as Lingiari, a Labor marginal in the Northern Territory where many voters are hard to reach online. It does factor in place of birth, but in marginal seats such as Bennelong, Reid and Tangney, with high numbers of voters of Chinese heritage only a third of whom are likely to have been born in mainland China, cultural heritage is another thing it ignores.
What of other seat-by-seat polls with samples of 800–1000 rather than the MRP’s samples, which average fewer than seventy? Some pollsters offer only incomplete figures, but in other cases comparisons — however rough — can be made.
Some results turn out to be very like YouGov’s. In Bradfield, a poll conducted for Climate 200 (3 February), shows a two-candidate split of 52–48, teal vs Liberal; the MRP figure, 50–50. In Cowper, another poll conducted for Climate 200 (“late” February), shows a two-candidate split of 53–47, teal vs Nationals; the MRP figure, 52–48. In Sydney, a poll conducted by uComms (17–18 March), shows a two-candidate split of 66–34, Labor vs Green; the MRP figure is 63–37. In Goldstein, another uComms poll (18–25 March), shows a two-candidate split of 54–46, teal vs Liberal; the MRP figures are identical.
Other polls show results very unlike YouGov’s. While the MRP describes Brisbane as “safe Labor,” the polling for Advance has it swinging to the Coalition. Where the MRP sees Ryan as “toss-up Greens” rather than a Coalition gain, Advance sees it as a Coalition gain. For the MRP, Griffith is “likely Labor” but Advance thinks it more likely to go to the Coalition, And though the MRP sees Macnamara as “likely Labor,” Advance has Labor finishing third. There is a similar contrast between the conclusion reached by Freshwater (for the Daily Telegraph) and the MRP: Freshwater sees the Liberals regaining Curtin, Kooyong, Goldstein, and Mackellar from the teals; YouGov doesn’t.
No doubt some of the differences between results reflect differences of a month or more in the fieldwork dates. But, surely, not all. In Goldstein, while uComms (18–25 March) has the Liberals behind 46–54, JWS (12–13 March) has them ahead 54–46. In Kooyong, where Freshwater (5–7 March) has the Liberals winning (the margin not disclosed), JWS has them behind 49–51.
Putting the names of the candidates — especially the independents — to respondents rather than asking a “generic” question can be one source of difference. In a Compass poll conducted in McMahon in early April but sketchily reported, an independent (Matt Camenzuli) is said to have received 41 per cent of the vote, the Liberal (Carmen Lazar) 20 per cent, and the Labor candidate (Chris Bowen, named?) 19 per cent; where the other 20 per cent went wasn’t stated. On these figures, Bowen would have lost his seat regardless of whether he finished second to Camenzuli or third. On the estimate produced by YouGov’s MRP, Labor led Liberal, 54–46; naming the independent on this ballot might have yielded a different result.
BOTH, ONE, NEITHER?
The pendulum (integral to the two-party narrative/story) and the MRP (the best test we will have of the single-seat story) could both prove accurate — the pendulum predicting Labor or the Coalition’s winning margin in terms of the number of seats, the MRP naming the seats that change and hence the net balance. In 2022, the pendulum underestimated Labor’s seat share and overestimated the Coalition’s by one or two; YouGov’s RPM overestimated Labor’s seat count by a similar number — three.
Another possibility is that the pendulum proves to be right — or much more nearly right than the RPM about the number of seats each side wins/loses. On the Guardian’s current modelling, the MRP is overestimating Labor’s vote share.
Conversely, the MRP may prove to be better than the pendulum in coming up with the net balance. The fact that it wasn’t a better guide to the result in 2022 doesn’t mean that it won’t be a better guide in 2025. When it comes to picking winners in non-classic contests, the pendulum has never been a guide; on these contests — for many, the most interesting of all — single-seat polling, including the massive effort involved in mounting an MRP, will have the field to itself.
The other possibility, of course, is that both the pendulum and the MRP prove wayward. In 1998, the pendulum was out by twelve, and didn’t predict the overall winner; it was out by six in 1987, and by five in 2010 — the only other time it hasn’t predicted the winner — and again by five in 2013. And in 2022 the MRP miscalled eleven of the 151 seats and erred by double figures with its estimates in several others. •