Where would we be without political opinion polls? Outside election campaigns, they tell us how the government and opposition are “travelling” and help determine the tone of reporting and commentary. Political events are interpreted through a largely poll-driven horse-race lens.
When an election is on the horizon, they tell us who will probably win. Yes, other ingredients are in the mix, such as a leader who has previously survived against the odds. Remember the lurking suspicion that Paul Keating (in 1996) and John Howard (in 2007) might pull rabbits out of the hat, like they’d done three years earlier?
But expectations are mostly driven by the surveys, reinforced these days by the betting markets, which also mostly come from the polls but are cited as if they’re independent. Political observers often internalise it all, and might even get to a point where they believe they don’t need the polls to tell them what’s going on: they can just feel it; a change of government is coming.
Not all polls are equal. The last polls in the campaign, published on or close to election day, ultimately matter most. That’s an understatement: reputations can live or die on them. If the market researcher gets that final one “right” then all the preceding ones can retrospectively be judged accurate as well. It’s why the pollsters usually put extra effort into that last one.
And sometimes those polls get it spectacularly wrong. When that happens, the fourth estate attracts a lot of criticism for being out of touch. They don’t understand their fellow citizens; they need to get out more. Very often the nagging comes from people who themselves thought the losing side would win. Sometimes journalists respond with performative hand-wringing and mea culpas: we must try harder. But being in or out of touch had little to do with it; it was the polls.
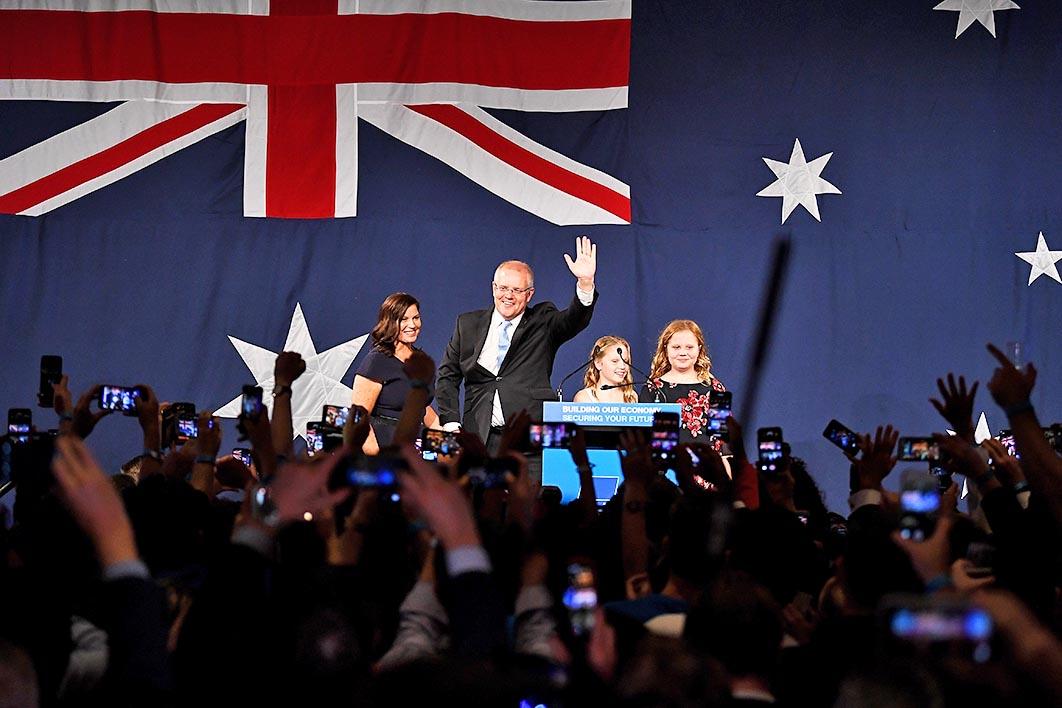
Well-publicised “polling disasters” in recent years include Britain’s shock 2015 election, the Brexit vote and the election of Donald Trump the following year, and our own “Morrison miracle” last year. But these were not the worst misses. The largest big-ticket polling misfire I’ve found was in the second round of France’s 2017 presidential election, when the final surveys averaged to about a twenty-five-point lead for Emmanuel Macron over Marine Le Penn but the result came in at a touch over thirty-two (66.1 to 33.9 per cent). The error largely escaped notice because, of course, a huge win is a huge win.
Our own Victorian state election in November 2018 was rather like that: averaged, the final surveys underestimated the size of the Andrews government’s two-party-preferred vote by more than three points (which means they understated the vote gap by more than six). So Labor was re-elected with 57.3 per cent after preferences, not 54 — who cares (apart from a few unemployed former Liberal MPs)? And in New Zealand this year the final polls were out by about eight points.
In other words, polling blunders only generate a fuss if the contest is pretty close and the error changes the result.
Brexit met these criteria. Its late-survey average of around 52–48 in Remain’s favour ended up 52–48 the other way. A four-point lead one way to four points the other is an eight-point miss. The 2016 error in the United States was only one or two points nationally, but polls dramatically underestimated Trump’s support in the three northwestern states of Michigan, Pennsylvania and Wisconsin. In each case, survey leads for Hillary Clinton of around five points turned into small (less than one point) Trump victories at the ballot box (or a six-point miss).
A year earlier, in Britain, the final polls suggested about 33.5 per cent apiece for the two main parties, pointing to a likely Labour minority government. Voters delivered a Tory majority, 36.9–30.4. And back home in Queensland that year, an expected narrow-to-comfy Liberal National Party victory became a small Labor one. (That polling failure came mostly from misfired preference-flow estimates, which is harder to avoid under optional preferential voting than in the compulsory version used federally and in Victoria. Queensland has since adopted the federal system.)
Finally, last year’s federal election saw a six-point error, turning the pollsters’ two-party-preferred Labor lead of 51.5 per cent into a 51.5 per cent Coalition victory.
What caused last year’s poll fail? Two days after the election, YouGov/Newspoll boss David Briggs was on the front foot in the Australian, claiming that Labor’s small national lead in the polls, after a pre-campaign narrowing, had never justified the wide expectation that Bill Shorten would become prime minister. That’s true enough at a macro level, but it doesn’t explain YouGov/Newspoll’s own final survey misses, or the exit poll on election day showing Labor on 52 per cent. Briggs also claimed vindication in some individual seat polling, but swing-wise, as blogger Kevin Bonham pointed out at the time, they were “just as bad as the national polls.”
In July this year, Essential’s Peter Lewis described a few changes his company had made, including weighting state by state. On preferences, Essential “will now be asking participants who vote for a minor party to indicate a preferred major party. Only when they do not provide a preference will we allocate based on previous flows.” This remains problematic because it still doesn’t take account of how-to-vote cards, which were the main cause of the difference between 2016 and 2019 One Nation flows.
Essential’s two-party-preferred numbers will henceforth be published with undecideds included (which is actually how the Americans, with first past the post, tend to do it). It’s good to know the percentage of undecideds, but publishing a pair of numbers that add to something under one hundred isn’t exactly a giant leap for mankind. Essential’s chief problem, which it shared with the others, was in the primary votes: too many for Labor and too few for the Coalition. (Ipsos can claim to have got Labor’s primary vote right, but it habitually overstates the Greens at the expense of Labor, and its Coalition number was way too low.)
What’s interesting is that the Great Australian Poll Fail was different from most of its international counterparts. Take the five final Brexit polls, which ranged from a ten-point Remain lead to a single point Leave’s way, averaging to four points in favour of Remain. A similar variety shows up in the state polling misses in the United States in both 2016 and 2020. In Australia last year, by contrast, you didn’t need a calculator to average the final five surveys, because they all said almost the same thing: Labor on 51, 51.5 or 52 per cent, Labor leads of two to four points.
What was going on? Some have suggested that the pollsters “herded,” and not just in the final polls. Kevin Bonham and others sounded the alarm during the campaign, and some had detected it in the 2016 federal election as well. The herding theory says that pollsters twiddle their figures to avoid standing out from the crowd. If every other pollster has Labor on 51 or 52 per cent, and your results give the Coalition 51, publishing and being damned would be courageous.
Back in the 2001 federal election, Roy Morgan Research showed immense courage when its polls showed Labor headed for a big win when the others all said the opposite. The others were right (although they all overstated the size of the Howard government’s victory) and Morgan lost its contract with the Bulletin magazine the next year.
One complication with applying the herding theory to the 2019 election was that the uniformity in the two-party-preferred findings belied a larger range of surveyed primary votes, with Coalition leads over Labor ranging from one to six points. Our compulsory preferential voting system tends to smooth results: shifts between Labor and Greens, for example, are mostly ironed out at two-party-preferred level. Herding would have involved adjusting published primary numbers as well (which wouldn’t be too challenging).
Is it possible that compulsory preferential voting, and rounding to the nearest integer to produce two numbers that add to 100, can give the appearance of herding? Do pollsters’ strategies for estimating preference flows have a smoothing effect? Maybe a bit. Perhaps two-horse races inevitably look a bit herded: Macron’s final polled 2017 numbers against Le Pen were 63, 62, 63, 62, 61.5, 62 and 62. And first-past-the-post Britain looked very herded (and wrong) in the final days of the 2015 election.
After last year’s federal election, the Association of Market and Social Research Organisations, or AMSRO, asked a bunch of brainy folks, including some very distinguished ones, to get to the bottom of it all. Their final report was published last month. (Media release here, executive summary here and full report here.)
A very long, deep-diving, fine piece of work it is, with the tables alone worth the price of entry.
But the authors don’t bury the lede (or not much anyway): they were seriously handicapped by a lack of cooperation from the four pollsters involved (four because YouGov and Newspoll are run by the same outfit). To seriously investigate what went wrong, they needed unweighted, unrounded data and details of sampling methodologies at the very least, but nothing like this was forthcoming. The most important consequence is that the herding question is explored but in the end left unanswered.
The report’s chief finding is that the pollsters’ samples were unrepresentative — too many educated, politically engaged Labor supporters — and there was not enough weighting to correct for that. That’s similar to Brexit and Trump 2016; but, as this paper notes, Australia’s pollsters last year didn’t feel the need to take account of any of those overseas lessons, probably because they had a splendid 2016.
The “shy” voter thesis, which has respondents too ashamed to admit they’re voting conservative, is convincingly dispensed with. This is a different proposition to the scenario of conservative voters disproportionately declining to participate in surveys, or not even being asked to, which is what seems to have happened. (Note that in France 2017, Victoria in 2018 and New Zealand in 2020, any “shy” respondents would have been supporters of the more left-wing party or candidate.)
Estimating two-party-preferred numbers from primary-vote support accounted for some of the misfire. It’s not the first time this has happened, and it’s not the worst; 2004 holds that honour. Relying solely on 2016 preference flows, when it was obvious that One Nation’s would more heavily favour the Coalition this time, was an unforced error. Newspoll/YouGov seems to have adjusted that assumption, although not, as it turned out, by enough. (During the campaign I suggested several times that pollsters’ two-party-preferred numbers were probably too kind to Labor.) It accounted for about 1 per cent of the two-party-preferred miss. The bigger problem was in the primary figures.
Does the pollsters’ refusal to share their sausage-producing lend weight to the herding thesis? You bet it does. But then, Australian polling, as this report illustrates, is the Wild West in the international context. Each outfit revels in its mystique and jealously guards its herbs and spices. If you’ve ever wondered (as some poll-watchers have) why the figures released by YouGov (previously Galaxy) display so little volatility, this analysis leaves you none the wiser.
It turns out that most of the pollsters scrutinised in this report are not even members of AMSRO. (YouGov joined in July 2020.)
In October this year, all of the aforementioned pollsters, except for Morgan, established, along with a few other pollsters, a new group, the Australian Polling Council. The press release announcing the formation contains a blessing from AMSRO, “welcom[ing] the formation of the Australian Polling Council as we believe that collective industry representation is vital to being able to establish and police appropriate quality and disclosure standards in the conduct of public opinion polling.” Many individuals in these pollsters are also members of the Research Society, and Morgan is a partner. A bit confusing for anyone outside the industry.
Among its recommendations, the AMSRO report puts forward a bunch of proposals involving pollsters signing up to robust governance rules, with “an appropriate arbitration and sanctions process.” Great idea, but I wonder how likely that is.
Then there’s this, from the discussion of international standards: “researchers/pollsters must not make claims that exceed the limits of the scientific principles on which opinion polls are based and be sure that interpretations and statements are fully consistent with the data.” It’s true: overstating the importance of an individual poll is the journos’ preserve, and that’s not going to change. If those who buy (or at least run) the surveys started treating them with the (lack of) significance they deserve (outside campaigns), they would cease to be publishable, at least on page one. Political polling is great publicity for market researchers, which is why they usually do it at cut price, or provide it free.
There’s a big underlying problem, of course. Three decades ago, 90 per cent or more of Australians had a landline telephone and would usually answer it when it rang. Now there’s a shrinking pool of available respondents and those who agree are more skewed towards the politically engaged. (The same with recruits to online panels.) Do the politically engaged tend more to the left than they used to? Is weighting by education the elixir some claim? In the 2020 American election, at which nearly everyone weighted by education, the poll average again overstated the Democrat candidate’s lead — by more than it had in 2016 nationally, in fact, and by about the same amount in key states.
(There’s a fascinating FiveThirtyEight podcast with J. Ann Selzer, who conducts polls for the main newspaper in Iowa’s capital, Des Moines. Her track record for that state’s contribution to national events, including the 2020 election, has been excellent, with some apparent outliers ending up vindicated. She’s a weight-by-education sceptic.)
Australian pollsters will always have the added problem of estimating two-party-preferred votes. They have to decide which minor parties are included on the initial list of parties offered to respondents. If they’re left off, their support is likely to be understated. If they’re included, it’ll probably be overstated. Until recently this has mostly been about Labor versus Greens support, which didn’t really matter in two-party-preferred terms. But supporters of One Nation (and recent variations of Clive Palmer’s parties) are more susceptible to following how-to-vote cards. And if people tell a pollster they’ll vote for the United Australia Party, but then don’t, who will they vote for?
I have a suggestion for pollsters: for half of their sample include only Labor and Coalition and “someone else” in the initial question, and for the other half offer a liberal list of parties. Comparing the two groups over time could be illuminating, giving clues to strength of support. Some pollsters ask respondents for preferences without necessarily publishing them, which is a desirable habit if only, again, for academic purposes. Pollsters should be more bold when anticipating likely preference flows, taking into account minor parties’ expected how-to-vote cards as well as recent elections.
Weighting is the obvious solution to unrepresentative samples. But as the AMSRO report notes, the more you fiddle, the greater the theoretical error. Maybe survey more people. Or maybe not; in 2019 the larger surveys weren’t necessarily more accurate. Education (university degree or not) seems blunt. A computer scientist, engineer or accountant is going to skew differently from an arts graduate, and perhaps be less interested in politics and less likely to respond to a survey.
Finally, Australians pollsters have long had a Queensland problem: federal Labor support is overstated midterm, and gradually whittles away as election day approaches. This happened again in 2019, and then some, and accounted for a lot of the failure. As the trajectory is always down as election day approaches, it can’t just be about sampling. It’s about what’s going on in Queenslanders’ heads. I don’t know what the solution might be.
We are now eighteen months into this term, and an election can be held from August next year without getting the two chambers out of sync.
In the United States, despite Joe Biden’s much bigger poll lead than Clinton’s four years earlier, general expectations, as measured by betting markets, favoured the Democrat to win but not by as much as they had in 2016. So observers factored in the 2016 poll miss, and the fact that Trump was candidate again. The result, closer than the polls indicated, vindicated this scepticism.
Whether our election is next year or in 2022, most of us will similarly downgrade the polls’ accuracy because of the 2019 result and Morrison’s perceived prowess. Labor would need a much bigger published lead (say, an average of 55–45 after preferences) to be perceived as the sure thing most believed in 2019. And with the chastened pollsters more nervous than last time, the temptation to find safety in the crowd could be even stronger.
Those motivations to herd aren’t going away. •